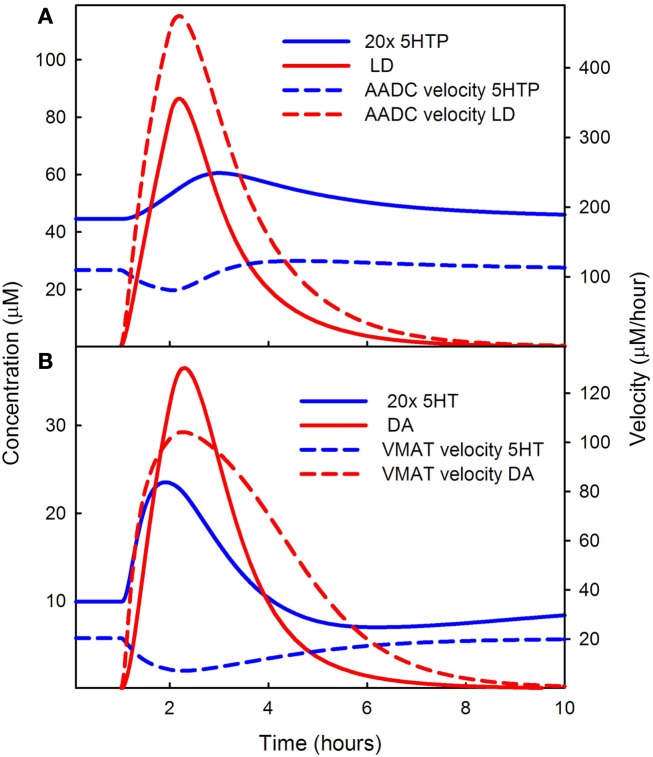
Figure 3.
Competition of LD for AADC and VMAT. In (A) the solid blue curve shows the concentration of 5HTP and the dashed blue curve shows the rate at which 5HT is being produced during the LD dose. The solid red curve shows the concentration of LD in the cytosol and the dashed red curve shows the rate of formation of DA in the 5HT neuron. Note that the solid blue curve blue has been multiplied by an extra factor of 20. LD outcompetes 5HTP for AADC because its concentration in the cytosol is much higher than the concentration of 5HTP. (B) Shows 20 times the cytosolic concentration of 5HT (solid blue curve) and the cytosolic concentration of DA (solid red curve). The rate of putting DA into vesicles (dashed red curve) is much higher than the rate of putting 5HT into vesicles. See Discussion in the text.

