Figure 7.
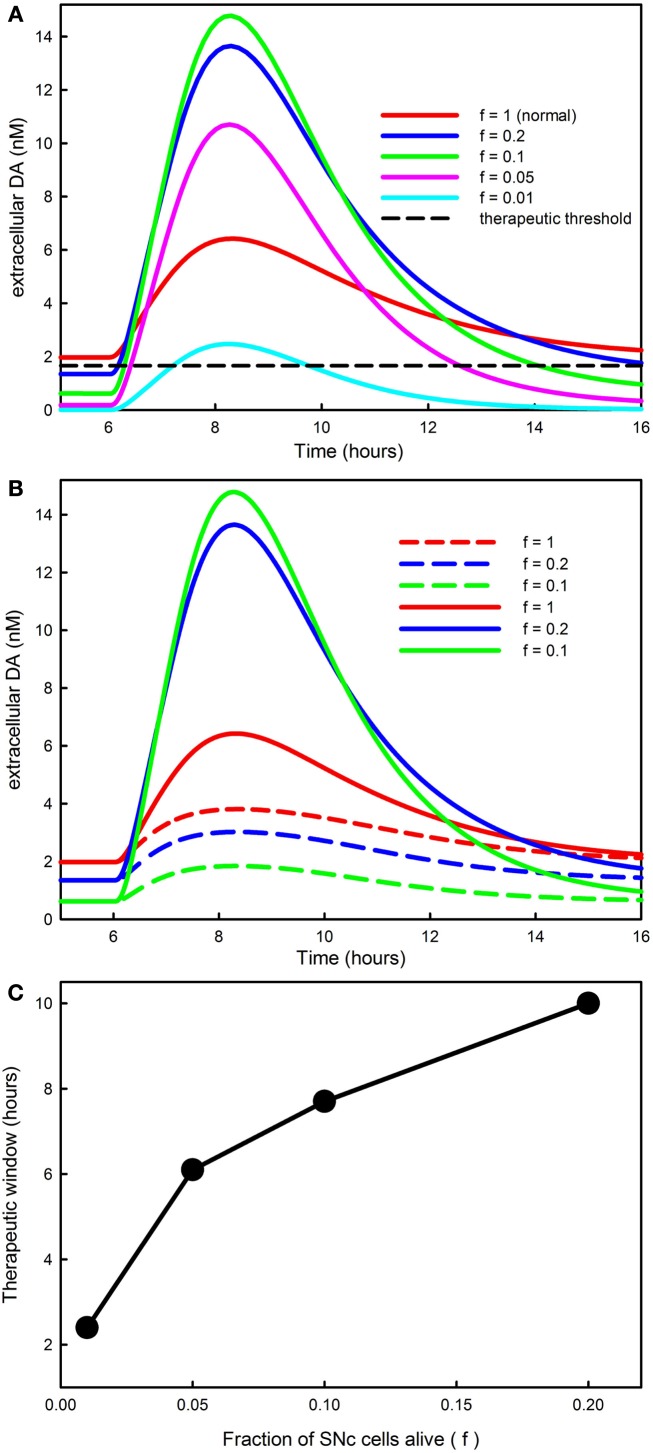
The progression of PD affects DA in the striatum and the therapeutic time window. (A) Shows the time course of extracellular DA in the striatum for different values of f, the fraction of SNc cells left alive. As f declines the curves get higher because there are fewer DATs to take up the DA released by 5HT neurons. However, when f is very small the peaks decline because removal mechanisms such as catabolism and diffusion become more important. The dashed black horizontal line in (A) represents the level of extracellular DA needed in the striatum for anti-Parkinsonian effects; see the Discussion in the text. (B) Reproduces the first three curves from [(A); solid curves, f = 1, f = 0.2, f = 0.1]. The dashed curves in the same color show the amount of extracellular DA in the striatum that comes from the DA neurons. For a normal individual (f = 1) the DA neurons contribute approximately 60%, but as SNc cells die (f = 0.2, f = 0.1) most of the DA comes from the 5HT neurons. (C) Shows that the amount of time that extracellular DA stays above the therapeutic level [the dashed black line in (A)] declines as PD progresses until it becomes approximately 2 h.

