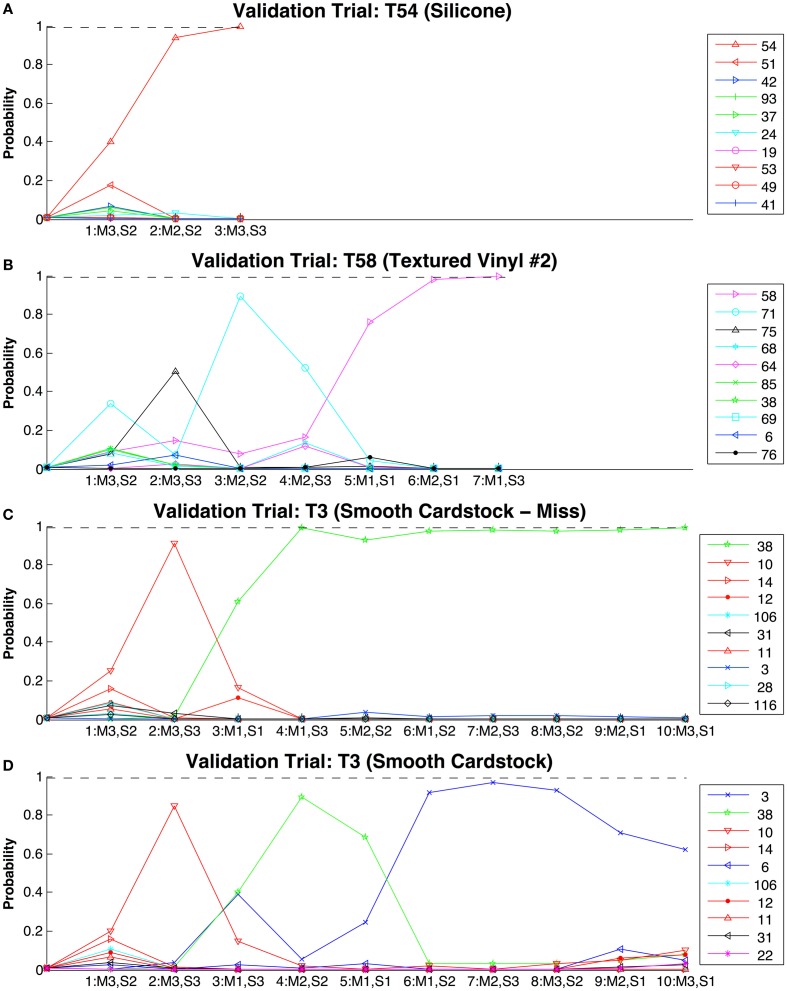
Figure 10.
Evolution of estimated probabilities as virtual exploratory movements are made to identify textures from the entire training set of 117 textures. In each of these plots the steps along the x-axis represent discrete exploratory movements, and the y-axis represents the estimated probabilities of likely texture candidates. The movement and signal taken at each step are indicated below the tick marks [Movements (M): 1 = 1.26 N, 1 cm/s; 2 = 0.5 N, 2.5 cm/s; 3 = 0.2 N, 6.31 cm/s. Signals (S): 1 = Traction, 2 = Roughness, 3 = Fineness]. The color-coded key for probability traces shows the numbers of the textures being classified in the validation trial. Dashed line represents the 99% confidence required to end the simulation before all 10 movements are made. In (A) texture 54 (Silicone) was rapidly identified, as was the case for many of the simulations. In (B) texture 58 (Textured Vinyl #2) was eventually identified after a few initially more probable candidates were ruled out. In (C) texture three (smooth cardstock) is shown being misidentified as balsa wood (T38) and in (D) correctly identified, although with only 60% confidence at the end of the simulation. In both cases no texture reached a confidence of above 99% to stop the simulation so it ran for the complete 10 trials.

