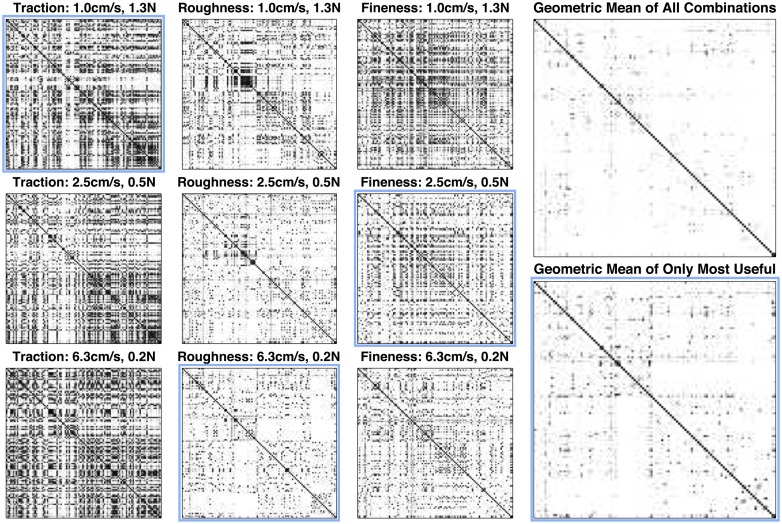
Figure 9.
Confusion probability matrices for each combination of exploratory movement and texture property and geometric mean of all signals and only the most useful combinations of signals and movements. Spots are scaled from white to black to represent low to high confusion. Axes in each inset represent the texture indexes. The solid black line on each diagonal indicates the value of unity, as each texture has a 100% chance of being confused with itself at all movements. Blue outlines indicate the optimal movement for each signal. The geometric mean of all confusion probability matrices have very few off-diagonal dark spots, whereas geometric mean of only the most useful exploratory movements for each signal have substantially more dark spots indicating potential confusion between similar textures and the value of multiple movements for each signal. By taking advantage of all combinations of exploratory movements and properties, rather than just the properties at their “optimal” movements, we see an improvement of 60% in the geometric average of the confusion probability matrices and overall uncertainty.

