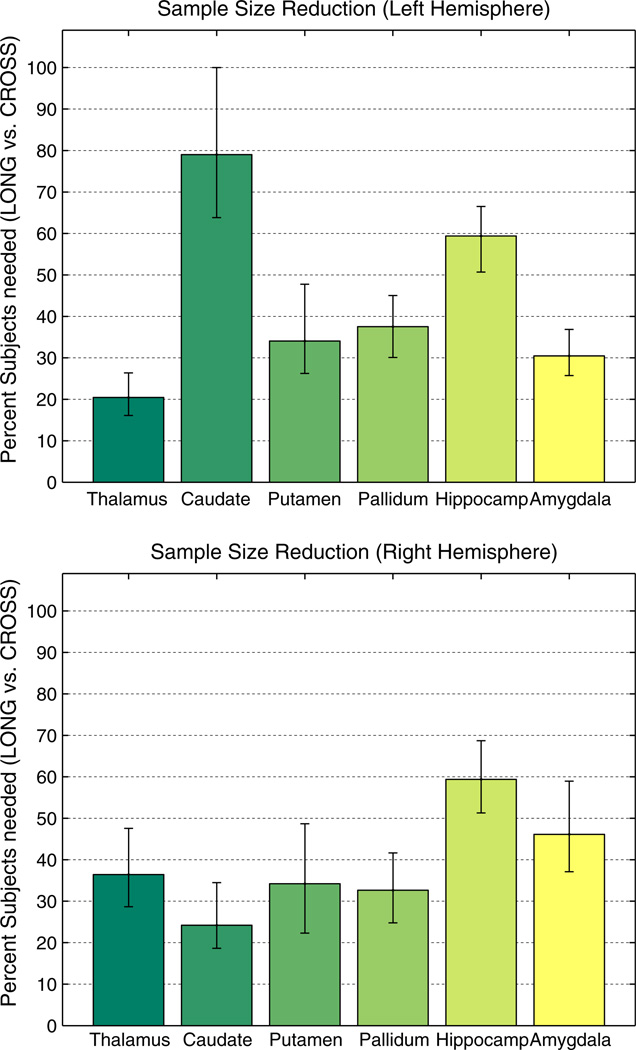
Fig. 10.
Percent of subjects needed in [LONG] with respect to [CROSS] to achieve same power at same p to detect same effect size. In most regions less than 40% of the subjects are needed. Equivalently this figure shows the reduction in necessary time points when keeping the number of subjects and within-subject variance of time points the same. Variance of measurements and correlation were estimated based on TT-14 using bootstrap with 1000 samples. Bars show median and error bars depict 1st and 3rd quartile.

