
Figure 1.
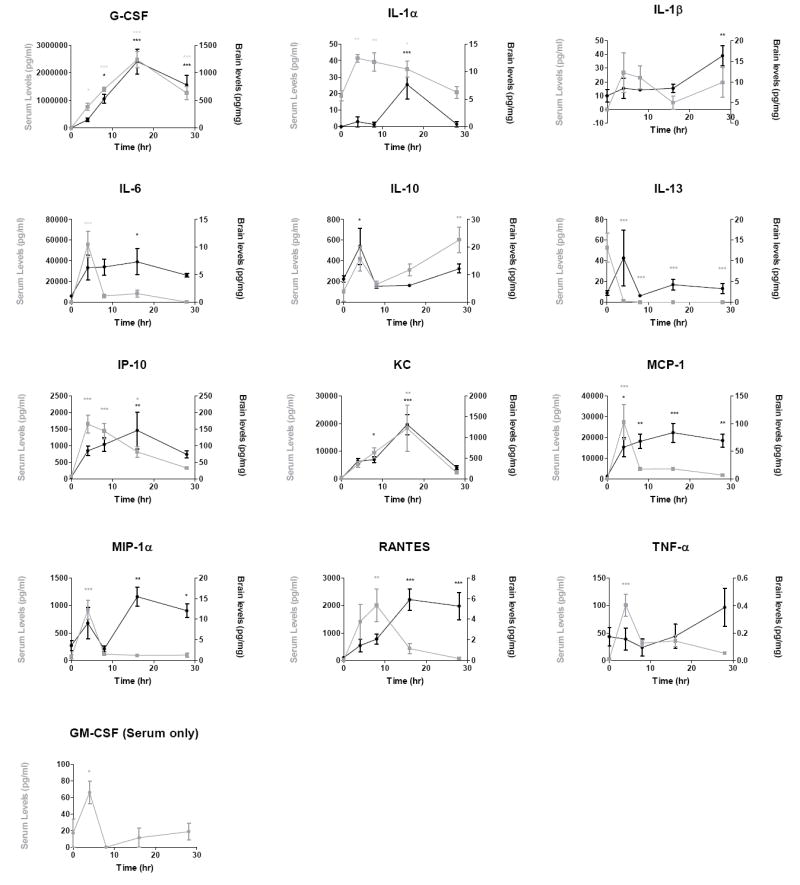
Time curves of 13 cytokines and chemokines quantified in serum and brain 0, 4, 8, 16, and 28 hours following a single injection of LPS. Data were analyzed by one-way ANOVA followed by Dunnett’s multiple comparisons test. Individual points were plotted as mean ± SEM, n = 7 per time point, * p≤ 0.05, ** p ≤ 0.01, *** p ≤ 0.001 compared to t=0.