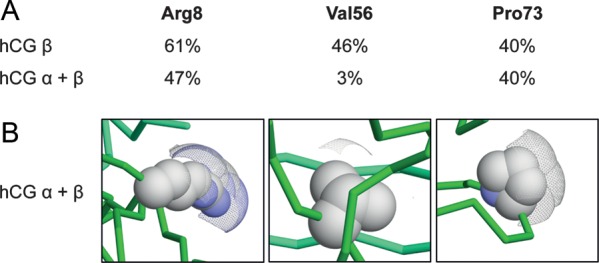
Figure 2.

Solvent accessible surfaces of hCGβ Arg8, Val56 and Pro73 in hCGβ alone and in hCGα/β. (A) The percentage of solvent accessible surface areas in hCGβ alone and in the intact hCGα/β complex. (B) Visual representation of SAS areas of hCGβ Arg8, Val56 and Pro73 residues in the hCGα/β complex using Voroprot (Olechnovič et al., 2011). Solvent accessible surface areas are displayed as a mesh.
