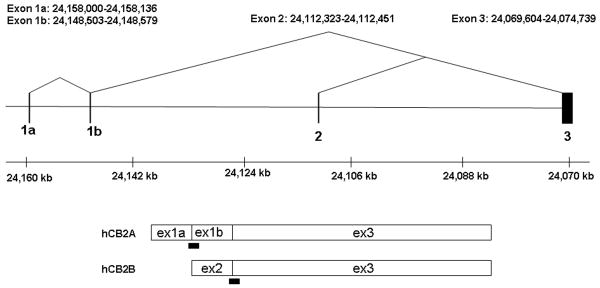
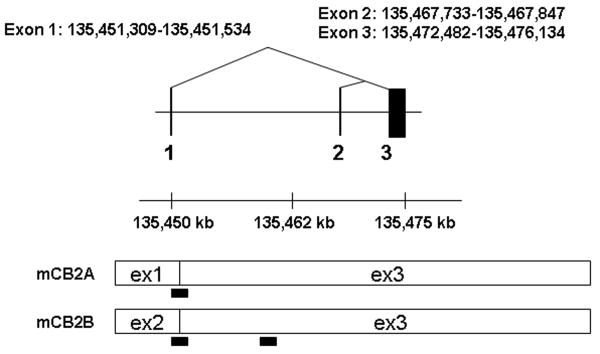
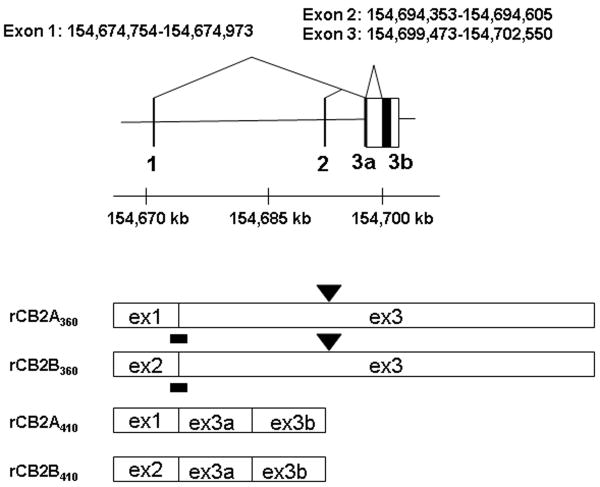
Figure 1.
A: Human hCB2 genomic structure and transcripts; B: Mouse mCB2 genomic structure and transcripts; C: Rat rCB2 genomic structure and transcripts. Horizontal line represents NCBI MapViewer's Homo sapians chromosome1p36.1 position Build 36.3, mus musculus chromosome 4D3 position Build 37.1, and Rattus norvegicus chromosome 5q36 position, Build RGSC 34.1. Vertical bars represent exons. Triangular lines represent splicing events. Open boxes represent spliced exons in mRNA transcripts. Black bars represent the location of TaqMan probes. Black boxes represent intraexonal splicing of rat rCB2 major coding exon and black triangles represent rat B2 retroposon insertions sites.


