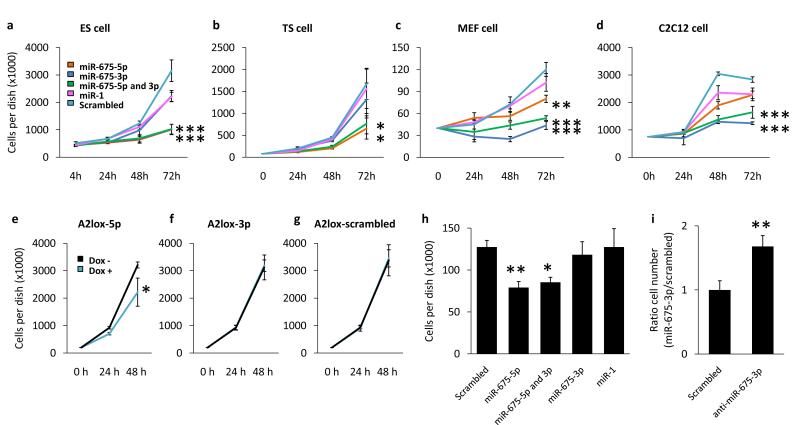
Figure 4.
miR-675 overexpression decreases the proliferation rate of a number of cultured cell lines. (a,b,c,d) Cell lines were transfected with miRNA mimics of either miR-675-5p (orange), miR-675-3p (dark blue), both miR-675 species in combination (green), miR-1 (pink) or a scrambled control (light blue) and cell numbers were counted at timepoints post transfection. This procedure was performed in ES (a), TS (b), MEF (c) and C2C12 (d) cells. (e,f,g) Using the A2lox-cre system (see methods) ES cell lines were created which upon the addition of doxycycline selectively express miR-675-5p (A2lox-5p) (e), miR-675-3p (A2lox-3p) (f) or a non-targeting scrambled control (A2lox-scrambled) (g). Cell numbers were counted at timepoints following the addition of doxycycline to the growth media (dox+, blue line) or in the absence of doxycycline (dox−, black line). n = 4. p-values were determined by two-way ANOVA followed by post hoc Tukey’s Test. (h) G401 cells were treated with the indicated miRNA mimics and cell numbers were counted 72 hours post transfection. n = 4. p-values were determined by Student’s t-test. (i) C2C12 cells were treated with either an inhibitor of miR-675-3p or a scrambled control. miR-675 expression was induced by differentiation and the cells counted following 96 hours of differentiation. n = 9. p-values were determined by Student’s t-test. All error bars indicate the s.e.m. * p < 0.05, ** p < 0.01, *** p < 0.001.

