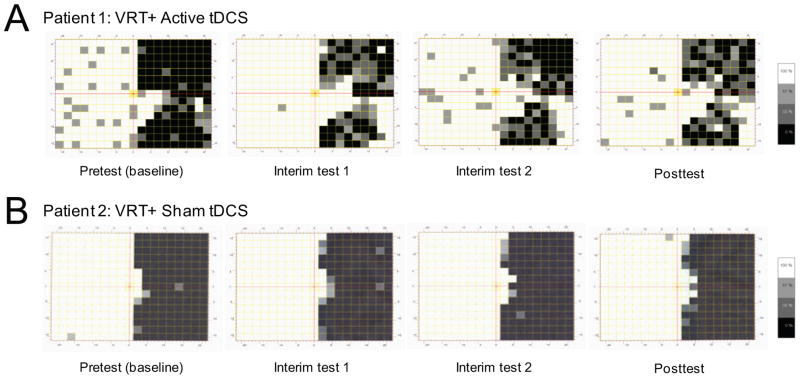
Figure 2.
Temporal Profile of Visual Field Functional Recovery in Representative Subjects. Comparing HRP assessments at pretest, interim test 1, interim test 2, and at posttest between representative patients from the VRT+active tDCS (patient 1) and VRT+sham tDCS (patient 2) groups. (A) For patient 1, the position of overall visual field border shifted from 3.37° at baseline to 7.17°, 6.76° and 6.92° at interim test 1, interim test 2, and at posttest respectively. Stimulus detection accuracy within the hemianopic field increased from 22.82% at pretest and reaching up to 48.32%, 44.52% and 50.11% at corresponding testing time points. (B) For patient 2, the position of overall visual field border shifted from 1.99° at baseline to 2.49°, 2.54° and 2.89° at interim test 1, interim test 2, and at posttest respectively. The stimulus detection accuracy within the hemianopic field increased from 13.42% at pretest and reaching up to 15.88%, 15.88% and 17.00% at the corresponding testing time points.

