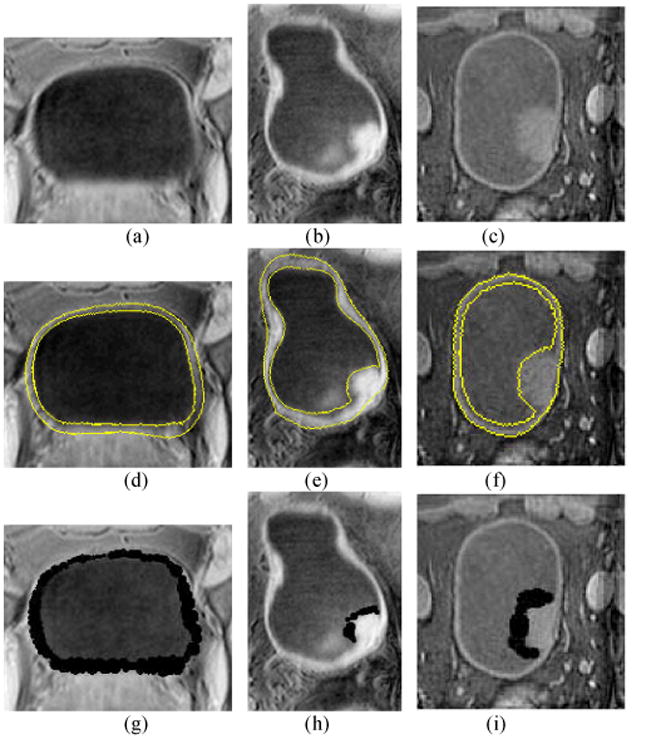
Fig. 8.

Example images to illustrate the window arrangement. The first, second and third rows show the original T1-weighte MR images, the segmented results by the coupled level set method and the window arrangement, respectively. Each column is from the same slice of the same dataset. The left column is the image from a volunteer. The middle and right columns are two patient cases with a tumor in each case. The segmented inner and outer borders of the bladder wall on images (d)–(f) are highlighted by yellow curves. The black regions on images (g)–(i) are the overlapping windows. Picture (g) shows the window on the normal bladder wall. Pictures (h) and (i) show the windows covering the tumor surfaces.
