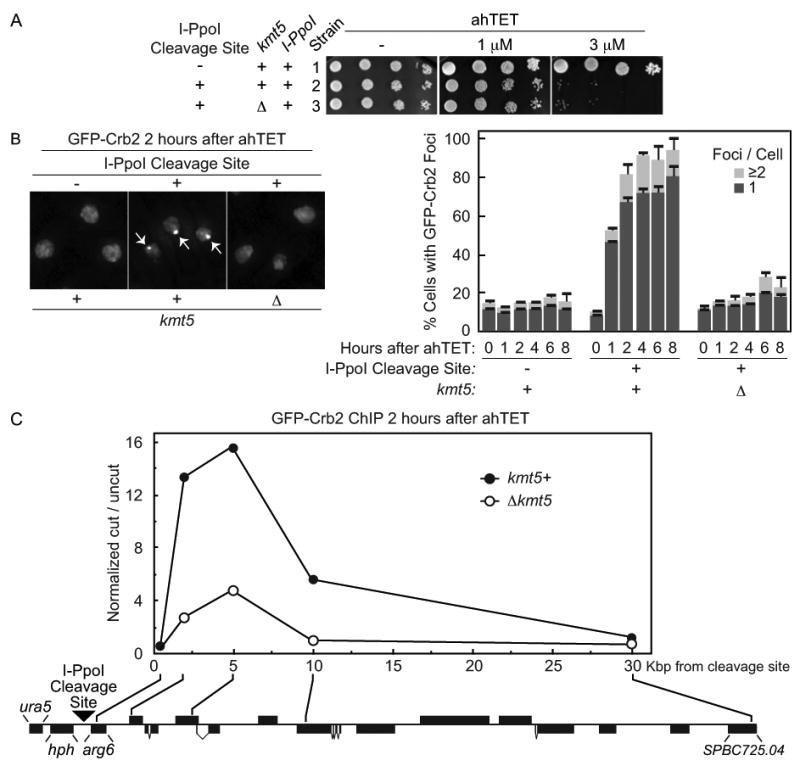
Figure 5.

The checkpoint protein Crb2 efficiently accumulates at an I-PpoI induced break in a manner that requires the H4K20 methylase Kmt5. (A) ahTET sensitivity of relevant strains. Strain 1 (YSS271) with an integrated tetracycline inducible I-PpoI allele, I-PpoI resistant rDNA repeats and GFP tagged crb2+ was generated and a single exogenous I-PpoI cleavage site then integrated at ura5+ (illustrated in (C)). to produce strain 2 (YSS289). The Kmt5 ORF was then replaced with a bsdMx6 marker to create Δkmt5 strain 3 (YSLS783). Spot tests were performed as detailed for Figure 2. (B) Live cell microscopy of GFP-Crb2 after induction of I-PpoI expression. The ahTET inducer was added to growing cultures of strains detailed in (A) to induce I-PpoI expression and live cell microscopy was performed at times indicated after ahTET addition. Left, representative images 2 hours after ahTET addition. Note that the nucleus of 3 different cells is denoted in each panel by GFP-Crb2 staining which is entirely nuclear. Arrowheads in middle panel denote GFP-Crb2 foci. Right, quantification of GFP-Crb2 foci, numbers were averaged from at least 3 independent experiments with ≥ 200 cells counted for each point. (C) ChIP of GFP-Crb2 at an I-PpoI induced break. Strains 2 and 3 from A were processed for anti-GFP ChIP 2 hours after induction of I-PpoI expression as described in Materials and methods. The relative enrichment of GFP-Crb2 at the break site was calculated by normalizing the cut/uncut ratio from each oligo pair flanking the cleavage site versus the cut/uncut ratio for an oligo pair at uncut lys1+. The location of the integrated I-PpoI cleavage site (black triangle), the hygromycin B selection mark (hph) and the approximate position of each oligo pair in the ura5-SPBC725.04 region of chromosome II is shown (drawn to scale, black boxes denote annotated ORFs, illustrated in the reverse complement orientation).
