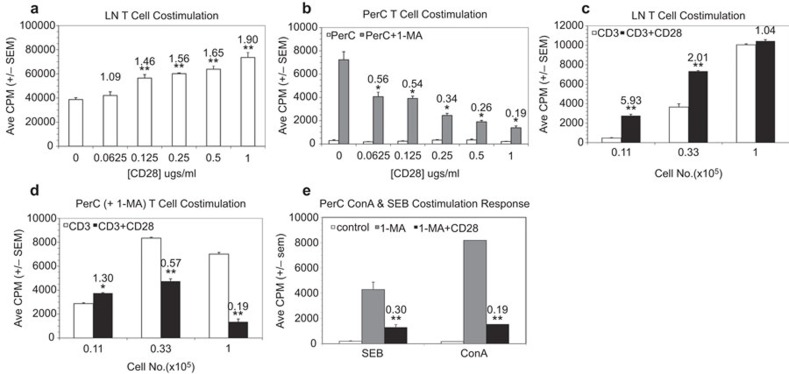
Figure 1.
CD28 ligation costimulates LN T-cell proliferation but suppresses the peritoneal cavity T-cell response. (a, b) Effect of anti-CD28 concentration. C57BL/6J LN (a) or PerC cells±1-MA (b) were cultured at 2×10⁵ cells per well with anti-CD3±CD28 costimulation. The numbers above the histograms are CIs which represent the average cpm for the costimulated response divided by the average CPM for the uncostimulated response; for PerC cells, CI values represent ratios of the costimulated PerC+1-MA response to the control (uncostimulated) PerC+1-MA response. *P<0.05; **P<0.005. The addition of 1-MA had no effect on LN T-cell proliferation; anti-CD28 in the absence of anti-CD3 had no effect on LN or PerC T-cell responses. (c, d) Effect of cell concentration on the CD28 costimulation response. Titered numbers of C57BL/6J LN or PerC cells+1-MA were cultured ±CD28 costimulation. CI values reflect comparisons within each cell concentration. (e) CD28 ligation cosuppresses the PerC T-cell response to SEB and ConA. 1.25×10⁵ PerC cells, ±1-MA, were cultured with SEB or ConA. CI values represent the ratios of the costimulated PerC+1-MA response to the control (uncostimulated) PerC+1-MA response. LN responses to SEB were 17 597±405 (−CD28) and 19 916±409 (+CD28) and to ConA were 42 977±4314 (−CD28) and 38 604±3395 (+CD28). Each experiment is representative of at least three independent experiments that yielded comparable, statistically valid results. CI, costimulation index; ConA, concanavalin A; LN, lymph node; PerC, peritoneal cavity; SEB, Staphylococcal enterotoxin B; 1-MA; NG-monomethyl-L-arginine.

