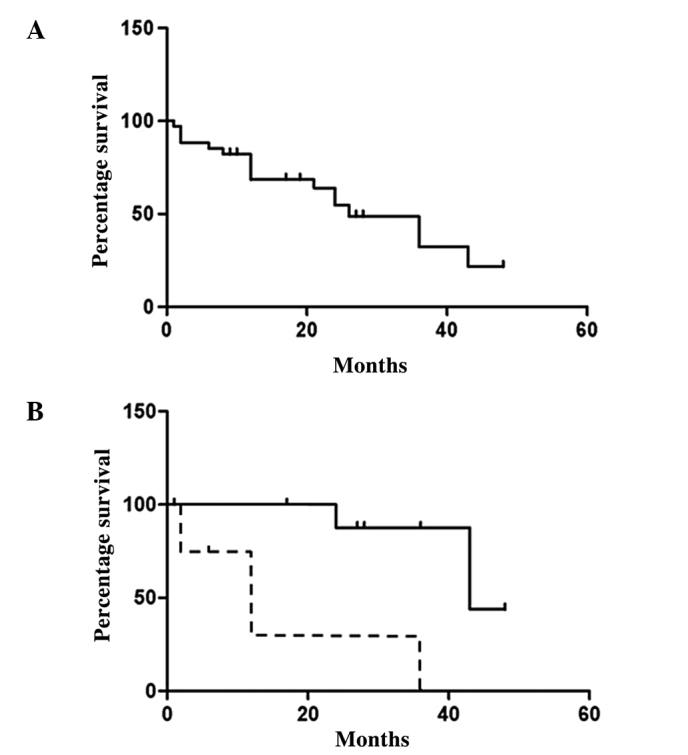
Figure 5.

(A) The Kaplan-Meier curve demonstrates the survival rate of patients with carcinoid tumors after skeletal metastasis (n=35). (B) The Kaplan-Meier curve shows that the survival of patients who developed osteolytic skeletal metastasis (dotted line) is worse than that of patients who developed osteosclerotic skeletal metastasis (solid line).
