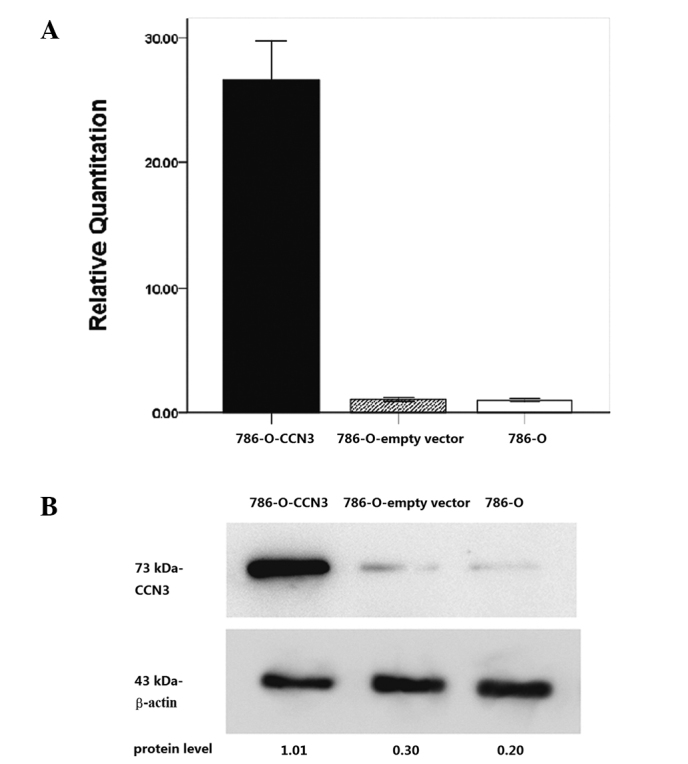
Figure 2.

Expression of CCN3 in CCN3-transfected 786-O cells. (A) Relative expression of CCN3 mRNA in CCN3-transfected clones with respect to the parental 786-O cell line used as a calibrator (2−ΔΔCt=1), by real-time PCR. Triplicate experiments for each sample were performed and results are shown as the mean ± SD. *P<0.05. (B) Increased expression of CCN3 in CCN3-transfected clones was confirmed by western blot analysis using a polyclonal antibody, which detected a 73 kDa band according to the manual. Protein levels were calculated by densitometry using actin as a normalization control.
