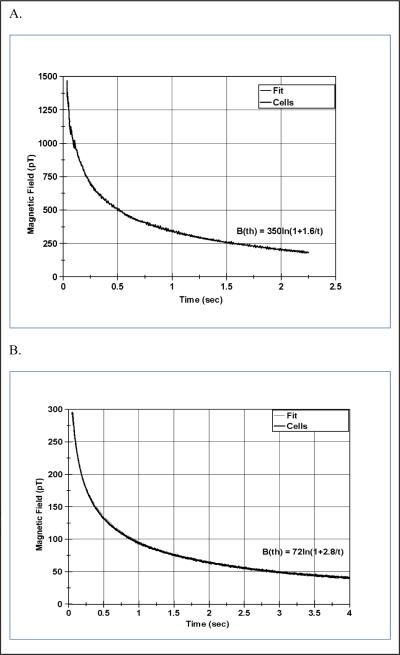
Fig. 3.
Magnetic relaxometry decay curves from sample containing 3.2E+06 cancer cells labeled with magnetic nanoparticles. Figure A is the field measured by the SQUID sensor and Figure B is the field measured by the AM sensor. The fit shown by the B(th) curve from equation 2 lies on top of the data and is not discernible from the data. The difference in amplitude between the SQUID and AM data is due to differences in the detector geometry and magnetizing field strength as described in the text.

