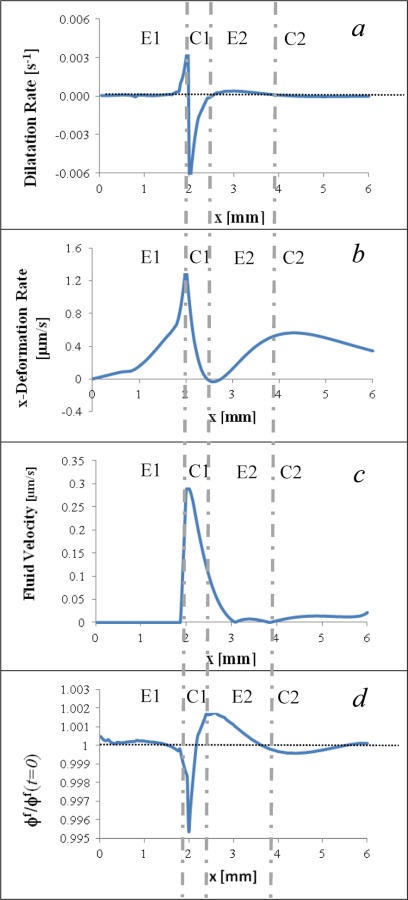
Fig. 10.

2D profiles taken from the upper surface of the ET when the freezing front is at location x = 2 mm (t = 140 s): (a) dilatational rate, (b) x-deformation rate, (c) fluid velocity, and (d) normalized fluid volume fraction with φf(t = 0) = 0.914 as the normalization factor. To aid in visualizing the alternating response, vertical broken lines were added to highlight the four successive regions labeled as E1 (primary expansion), C1 (pri-mary compression), E2 (secondary expansion), and C2 (secondary compression).
