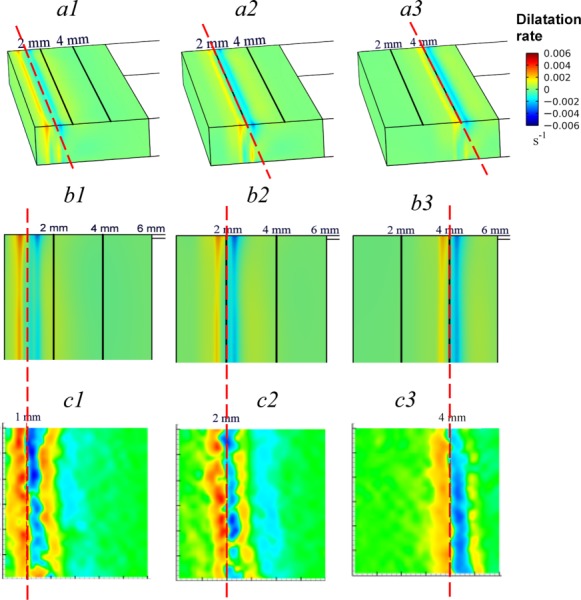
Fig. 4.

(a1) Contours showing model predicted 3D dilatation rate in the ET when the freezing front is at location x = 1 mm, (a2) x = 2 mm, and (a3) x = 4 mm. (b1) 2D Contour of dilatation rate at the upper surface of the ET when the freezing front is at location x = 1 mm, (b2) x = 2 mm, and (b3) x = 4 mm. (c1) Contours showing measurement of 2D dilatation rate derived using CID [33] when the freezing front is at location x = 1 mm, (c2) x = 2 mm, and (c3) at location x = 4 mm. Reference line over (a1), (a2), and (a3) and that across (b1)-(c1), (b2)-(c2), and (b3)-(c3) pairs are to highlight the instantaneous location of the freezing front between modeling predication and measurement.
