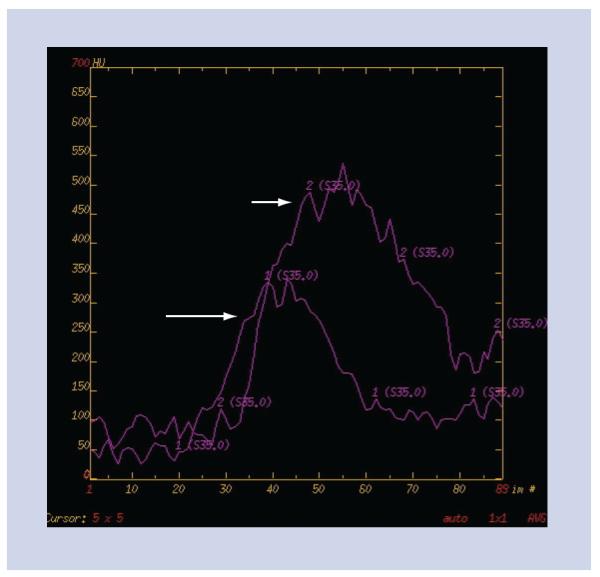
Figure 3. Time–density curves.

Time–density curves for the arterial input function (long white arrow) and the venous output function (short white arrow) are used to calculate the perfusion maps.

Time–density curves for the arterial input function (long white arrow) and the venous output function (short white arrow) are used to calculate the perfusion maps.