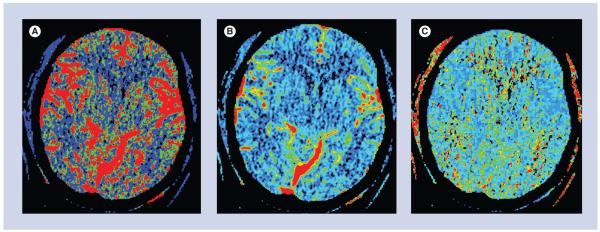
Figure 4. Perfusion maps.
(A) Cerebral blood flow map depicts the volume of blood moving through a given volume of brain tissue per unit time. (B) Cerebral blood volume map depicts the total volume of blood in the arteries, veins and capillaries. (C) Mean transit time map depicts the average time of blood transit from the arterial inlet to the venous outlet.

