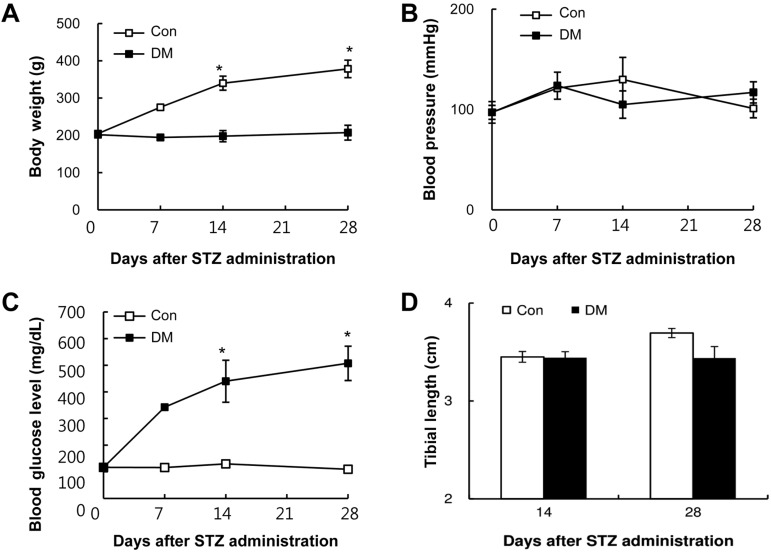
Figure 3.
General features of diabetic rats. A, Body weight of STZ-induced diabetic vs. control rats. *P<0.01 B, Blood pressure of STZ-induced diabetic vs. control rats. C, Blood glucose level of STZ-induced diabetic vs. control rats. *P<0.01 D, Measurement of tibia length in control and diabetic rats after 14 and 28 days of STZ treatment. In comparison to the untreated control, the diabetic rats show suppressed bone growth. *P<0.05.

