Figure 6.

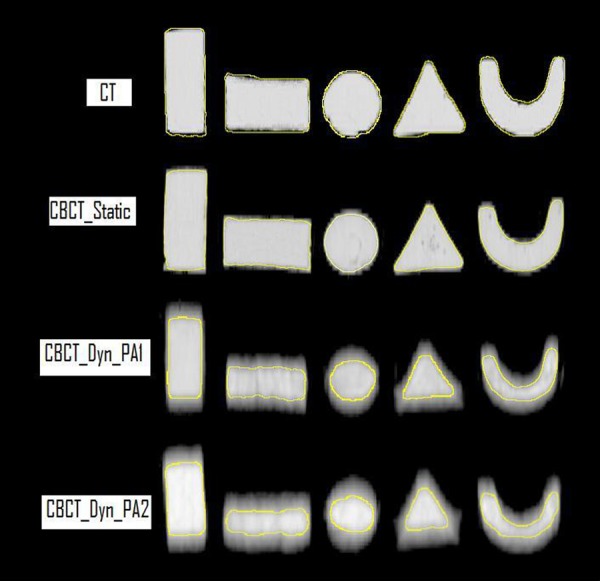
The reconstructed volume loss for the targets imaged in static and dynamic modes using CBCT on comparison with reference CT. The yellow line indicates the contouring of targets for HU WW −500 to 0.

The reconstructed volume loss for the targets imaged in static and dynamic modes using CBCT on comparison with reference CT. The yellow line indicates the contouring of targets for HU WW −500 to 0.