Figure 1.

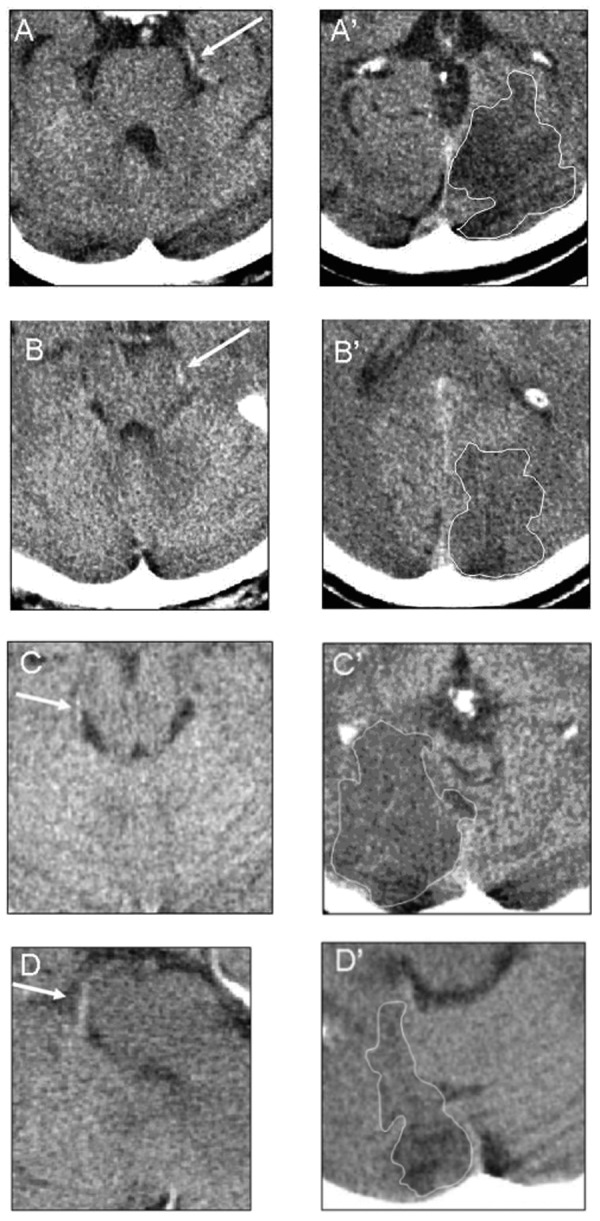
The HPCA sign on CT. Examples of the HPCA sign (A–D, marked by the white narrows) in proximal and distal parts of the P2 segment with the corresponding ischemic lesions (A’–D’ respectively). The infarct areas marked by contours in white.

The HPCA sign on CT. Examples of the HPCA sign (A–D, marked by the white narrows) in proximal and distal parts of the P2 segment with the corresponding ischemic lesions (A’–D’ respectively). The infarct areas marked by contours in white.