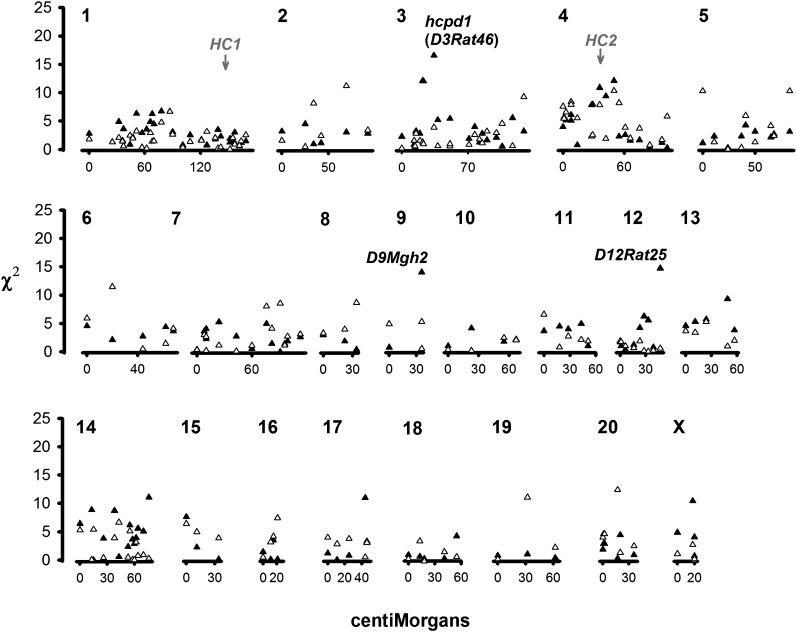
Figure 2 .
χ2 scores from nonparametric testing of absolute residuals (phenotypic dispersion, PDi) for urinary calcium in male (solid triangles) and female (open triangles) female F2 GHS × WKY rats. The location of the significant quantitative trait locus (hcpd1) and the suggestively linked markers D9Mgh2 and D12Rat25 are indicated; also indicated are the significant QTL for classical mean differences in urinary calcium HC1 and HC2 (Scheinman et al. 2008).

