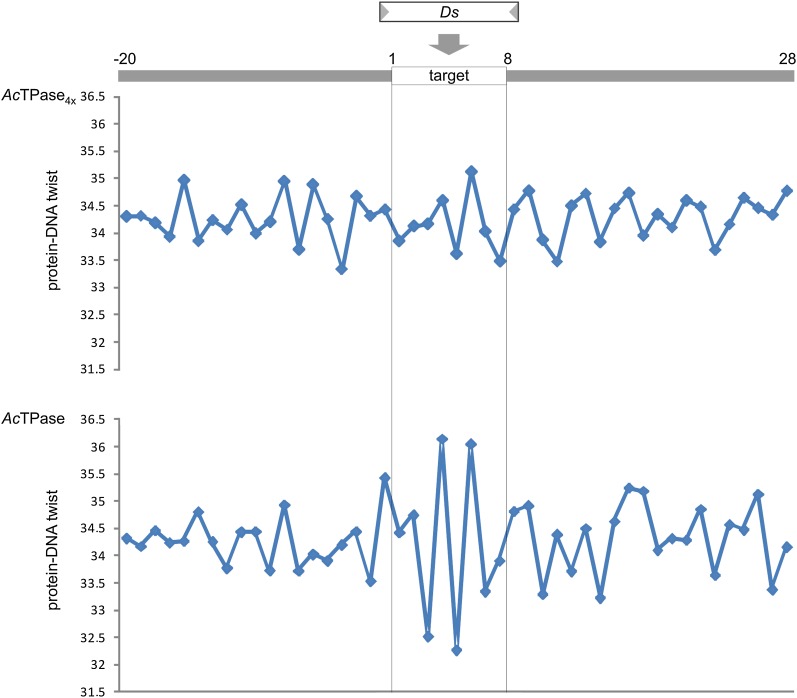
Figure 5 .
Predicted twist-angle torsion at Ds insertion sites in yeast. Average values for protein-DNA twist (y axis) are plotted for each nucleotide position against the sequence of the 8-bp Ds insertion sites ±20 bp adjoining sequence (x-axis) from 35 AcTPase4x-generated Ds insertions (top) and 18 AcTPase-generated Ds insertions (bottom). The borders of the 8-bp Ds target sites are indicated by the vertical lines.

