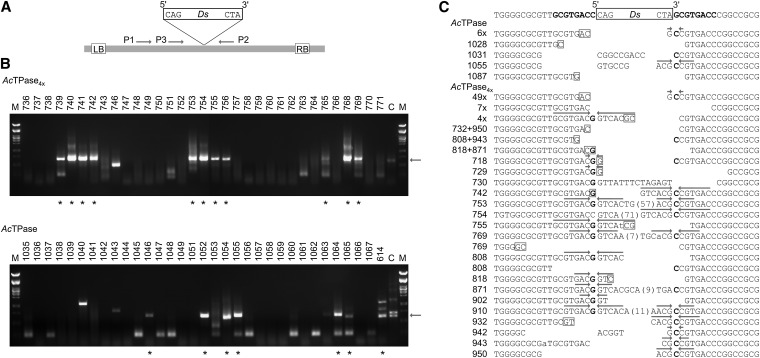
Figure 6 .
Analysis of Ds excision sites in Arabidopsis. (A) Schematic of the T-DNA in pCAM10ATG. LB, left T-DNA borders. RB, right T-DNA borders. Ds, 3-kb Ds element. P1–P3, primers used for amplification of empty Ds donor sites. (B) Screen for somatic Ds excision events. For each transposase, a representative agarose gel for screening and recovery of Ds excision sites from individual Arabidopsis plants is shown. Arrows at the right indicate the expected size for empty Ds donor-site amplificates of ∼687 bp. Asterisks indicate PCR products from individual plants that approximate this size and were subjected to sequence analysis. (C) Ds excision footprints formed by AcTPase and AcTPase4x in Arabidopsis. The top line shows the sequence at the Ds donor site. Letters in boldface flanking the Ds indicate the 8-bp target-site duplication. The lines below show transposon footprints in individual plants after Ds excision by AcTPase or AcTPase4x. The predominant footprint gc was detected in 6 AcTPase (“6×”) and in 49 AcTPase4x individuals (“49×”). A “restoring” excision product was recovered from seven AcTPase4x plants (“7×”). Four individual AcTPase4x plants share the same footprint (“4×”). From plant nos. 769, 818, 871, 943, and 950 two and from plant no. 808 three distinct footprints were isolated, respectively. Bases with weak signal strength in the sequence reads are indicated in lowercase. Putative microhomologies at flanking DNA fusion sites are indicated as boxed nucleotides. Arrows above sequences highlight inverted repeats centered around the complementary bases G and C of the nucleotides bordering the Ds element that result from resolution of intermediate hairpin structures formed at the Ds-flanking host DNA during excision.

