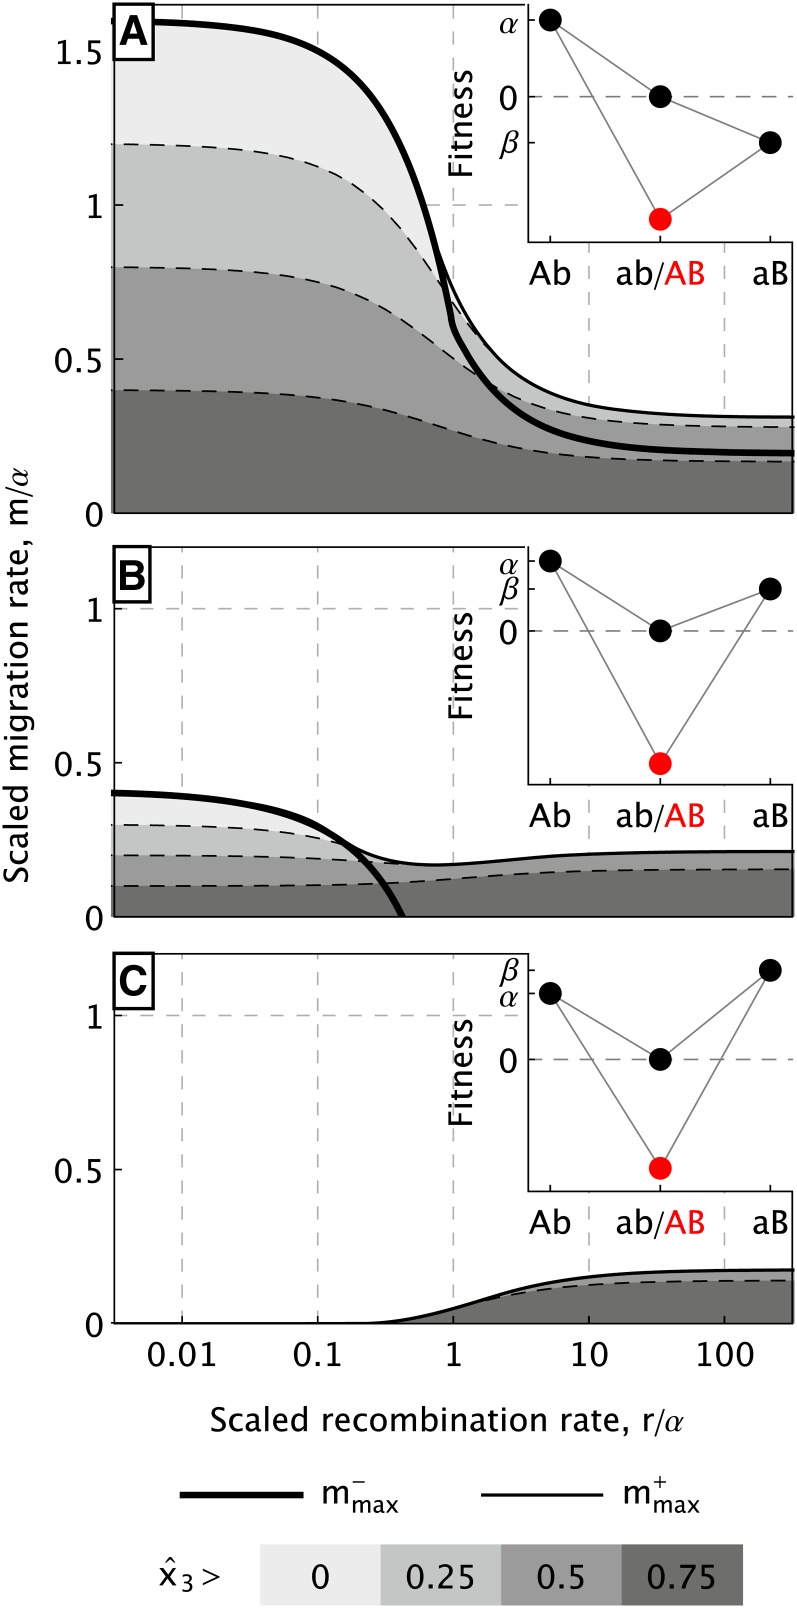
Figure 1 .
Maximum migration rates (black solid lines) and degree of population differentiation (gray areas) as functions of the (scaled) recombination rate r. We identify three regimes. (A) Selection against immigrants for slope-type fitness. Here, β/α = −0.6, γ/α = 2.5. (C) Selection against hybrids in a homogeneous environment. Here, β/α = 1.2, γ/α = 4. (B) Combination of both for intermediate fitness combinations. Here, β/α = 0.6, γ/α = 4. The corresponding type of fitness landscapes is displayed in each respective top right corner.

