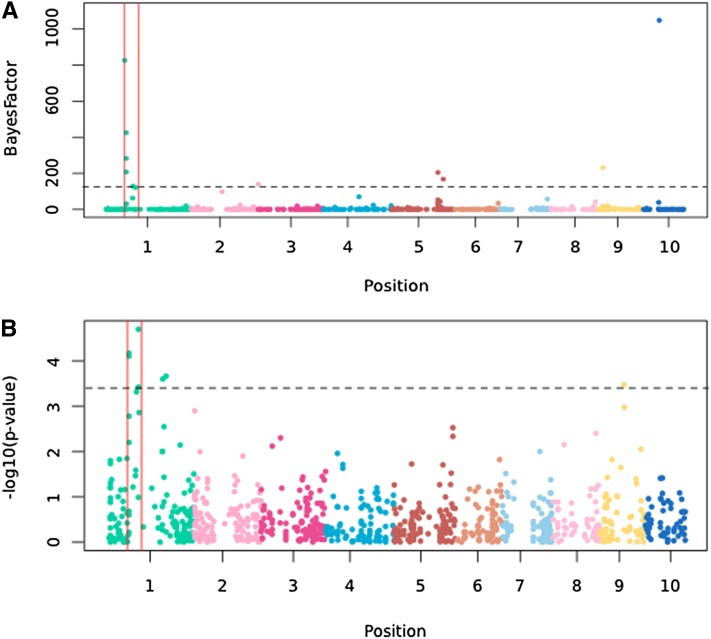
Figure 5 .
(A) Bayes factors for correlation between allele frequencies and altitude in 33 natural parviglumis populations. Inv1n is indicated by red vertical lines. The 99th percentile of the distribution of Bayes factors is indicated by a horizontal dashed line. Chromosomes 1–10 are plotted in order and in different colors. (B) Association between all SNPs and culm diameter. SNPs significant at 5% FDR are above the dashed line.

