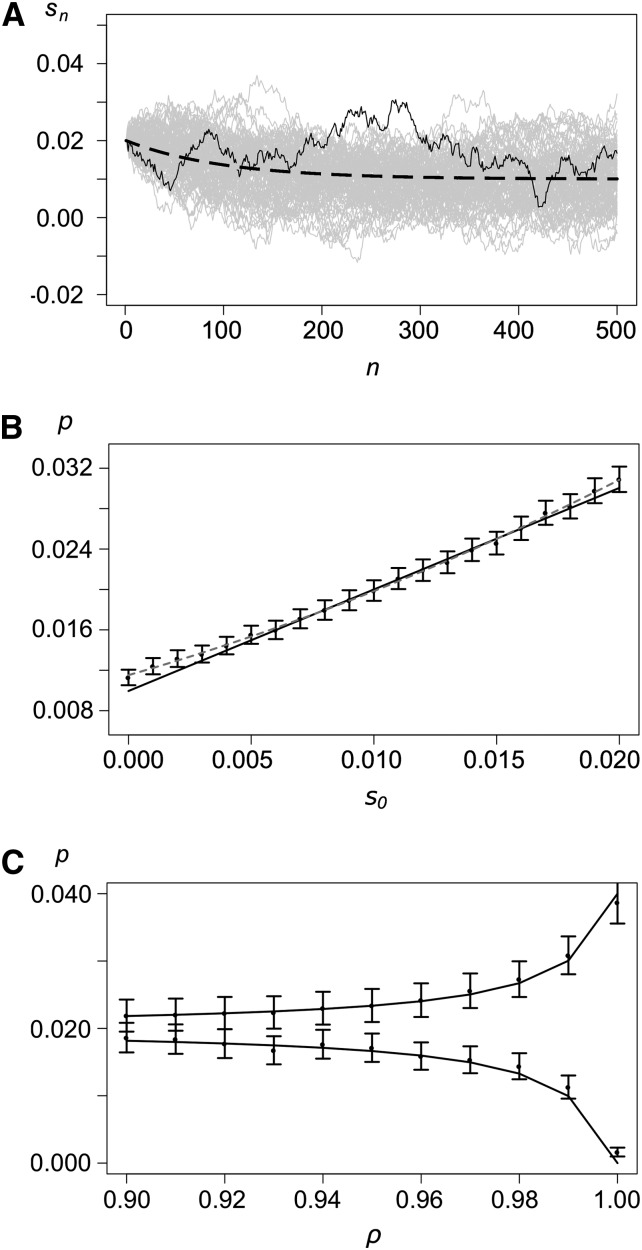
Figure 3.
The autoregressive model. (A) Examples of realizations with s0 = 0.02, , σ = 0.001, and ρ = 0.99. The dashed curve shows the mean selection coefficient, and the solid curve shows a single realization. Shaded lines show 50 additional realizations. (B) Probability of establishment as a function of the initial selection coefficient s0. The solid curve shows the analytical approximation (19), solid dots show results from simulations, and the whiskers show 99% confidence intervals. The shaded dashed line shows the quadratic regression line of the simulated points. Values for the other parameters are as in A. (C) Establishment probability as a function of ρ for s0 = 0.02 (top) and s0 = 0 (bottom). Other parameters are as in A.

