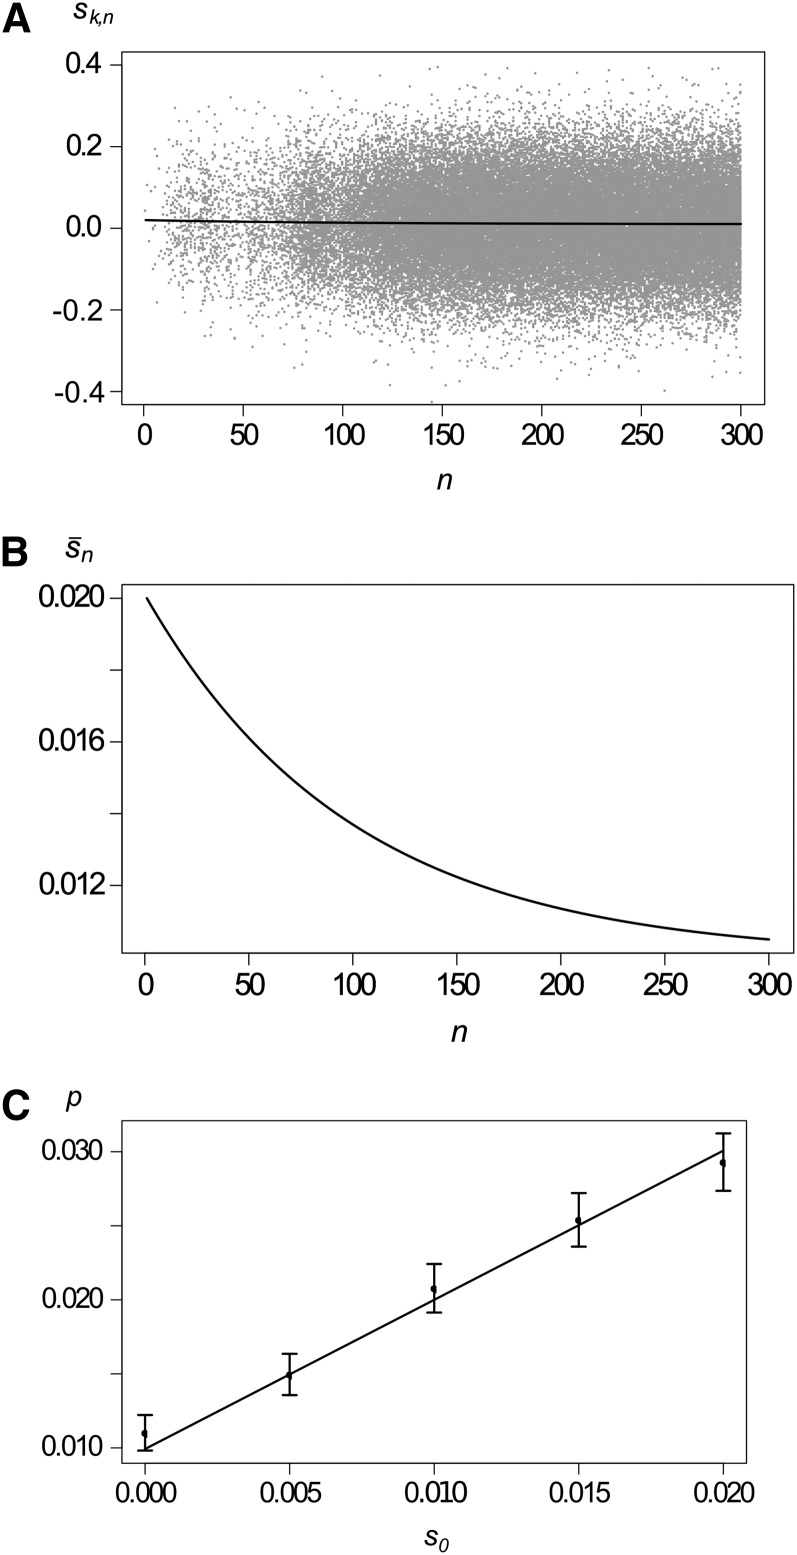
Figure 4.
Variation within generations. (A) Illustration of a branching process with variation in offspring distributions within generations. The solid curve shows the mean selection coefficient with κ = 0.01, σ = 0.1, and s0 = 0.02, and shaded dots show selection coefficients of mutant copies for a single realization. (B) The expected selection coefficient on a different scale. (C) Probability of establishment as a function of the initial selection coefficient s0. The solid curve shows the analytical approximation, solid dots shows results from simulations, and the whiskers show 99% confidence intervals. Other parameters are as in A.

