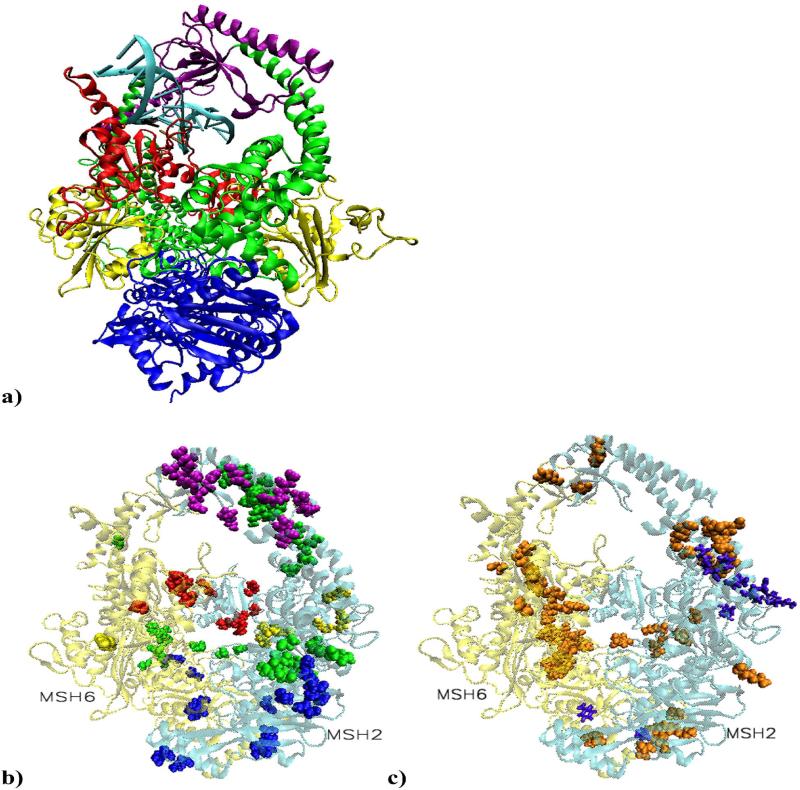
Figure 1.
a) Structural model of MutSα in complex with a 15 base pair duplex DNA containing a central G-T mismatch. DNA is shown in light blue with the mismatch pair marked: black for guanine and ochre for thymine. The color code for the heterodimer domains is: red for the mismatch binding domain, residues 1 to 124 in MSH2 and 1 to 157 in MSH6; yellow for the connector domain, residues 125 to 297 in MSH2 and 158 to 356 in MSH6; green for the lever domain, residues 300 to 456 and 554 to 619 in MSH2, and 357 to 573 and 648 to 714 in MSH6; purple for the clamp domain, residues 457 to 553 in MSH2 and 574 to 647 in MSH6; blue for the ATPase domain, residues 620 to 855 in MSH2 and 715 to 974 in MSH6. Note that in our system, residue 1 of MSH6 corresponds to residue 362 in the solved structure. b) Residues on the list of cancer causing mutations or deletions involved in highly significant correlated atom displacements. The large majority is unique for the platinum cross-linked complex and located on the surface of MSH2 subunit, covering all five domains.
c) Proposed cancer related highly significant correlations. In violet are residues associated with the mismatched system and in orange those associated with the damaged system. The predicted repair signaling residues are on the surface of the connector, lever and ATPase domains of MSH2. In the damaged complex, distinctively, most of MSH6's predictions are on the heterodimer interface (mismatch binding, connector, lever and ATPase domain), while MSH2's predictions are on its surface (connector, lever, clamp and ATPase domains).

