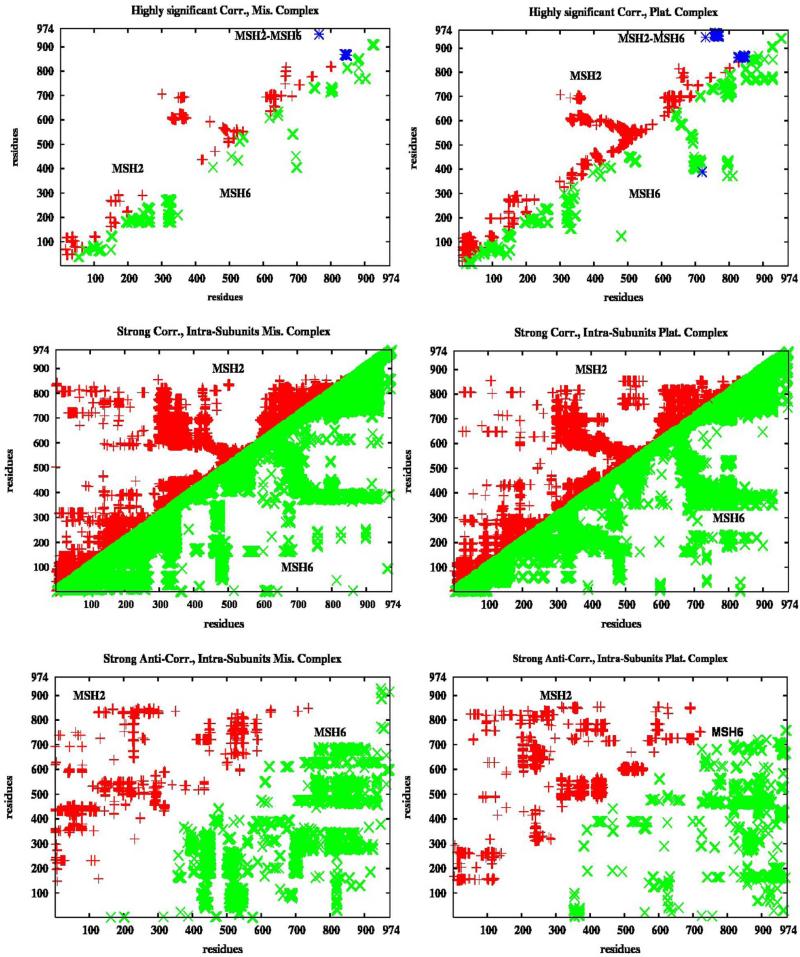
Figure 2. Intra-subunits Correlations.
In red and green are represented correlations within MSH2 and MSH6, respectively. The highly significant correlations (only covariance between residues at least ten units apart) are twice as many in the platinum cross-linked complex than in the mismatched complex. Almost continuous strong correlations are seen throughout the subunits. Different patterns are seen in the anti-correlations in the two complexes. There is a limited number of highly significant correlations between the two subunits, data in blue. High correlations between the atomic displacements of adjacent residues are expected, but when considered those between residues at least ten units apart there are 2429 such correlated motions within

