Figure 1. .
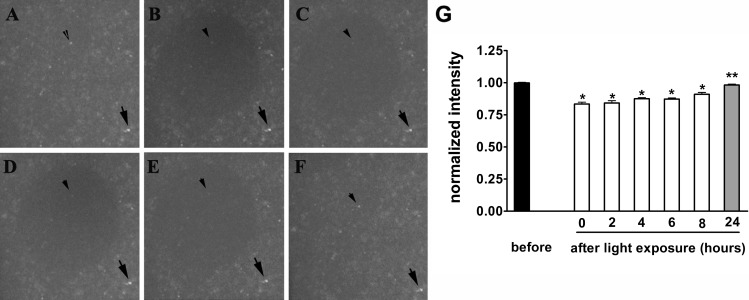
Fluorescence bleaching and recovery. Fluorescence microscopic images. ARPE-19 cells that had accumulated A2E were exposed to 480 nm light (25 seconds). (A) Before light exposure. (B) Immediately after exposure. (C) 2 hours after exposure. (D) 4 hours after exposure. (E) 8 hours after exposure. (F) 24 hours after exposure. (G) Arrows, fluorescent spot outside area of illumination; arrowhead, fluorescent spot inside area of illumination. Fluorescence measured as relative grey scale values. For normalization, the intensity values within the irradiated area were expressed relative to values in the surround. *P < 0.001 as compared with values before exposure. ** Not different (P > 0.05) as compared with values before exposure. Values are mean ± SEM of three replicates.

