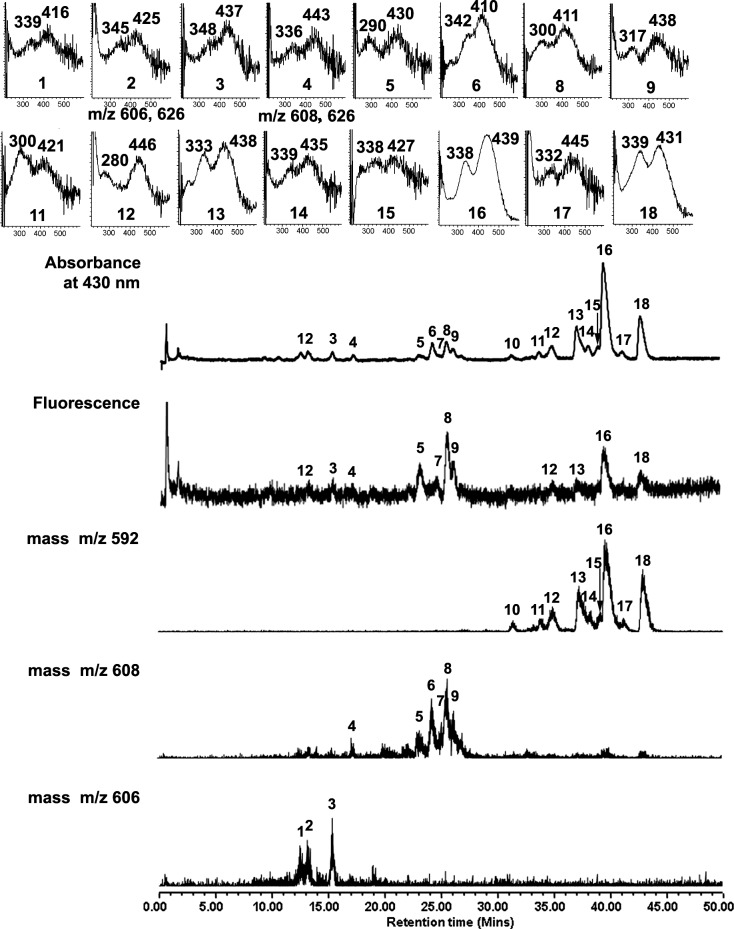
Figure 3. .
UPLC-ESI analysis of cell-associated A2E following irradiation (430 nm, 6 minutes). Chromatographic display demonstrating detection by absorbance, fluorescence, and mass. Absorbance was monitoring at 430 nm; fluorescence detected with 430-nm excitation and 600-nm emission. Selected ion monitoring at 592, 608, and 606. Insets above, UV-visible absorbances.

