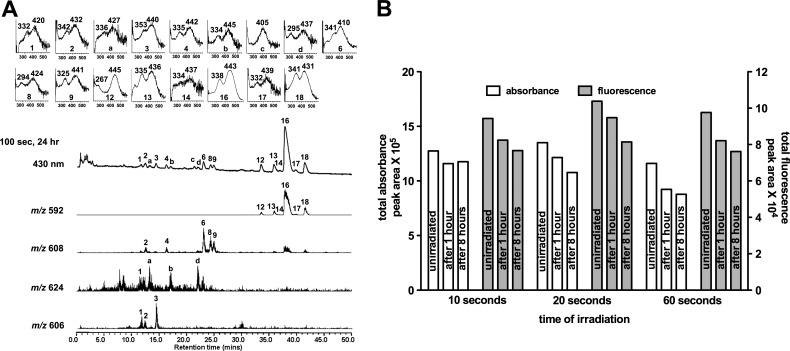
Figure 8. .
UPLC-ESI analysis of cell-free A2E following irradiation (430 nm). (A) Chromatographic display demonstrating detection by absorbance, fluorescence, and mass; 100 seconds irradiation, 24 hours after irradiation. Absorbance was monitored at 430 nm; fluorescence detected with 430 nm excitation and 600 nm emission. Selected ion monitoring at 592, 606, 608, and 624 nm. Insets above: UV-visible absorbances. (B) Total absorbance and fluorescence following irradiation of cell-free A2E (10, 20, and 60 seconds) with analysis at 1 and 8 hours after irradiation. Individual compounds were quantified as peak area and summed. Data are representative of two experiments.

