
Figure 1. Cntnap2−/− mice show epileptic seizures and abnormal EEG pattern.
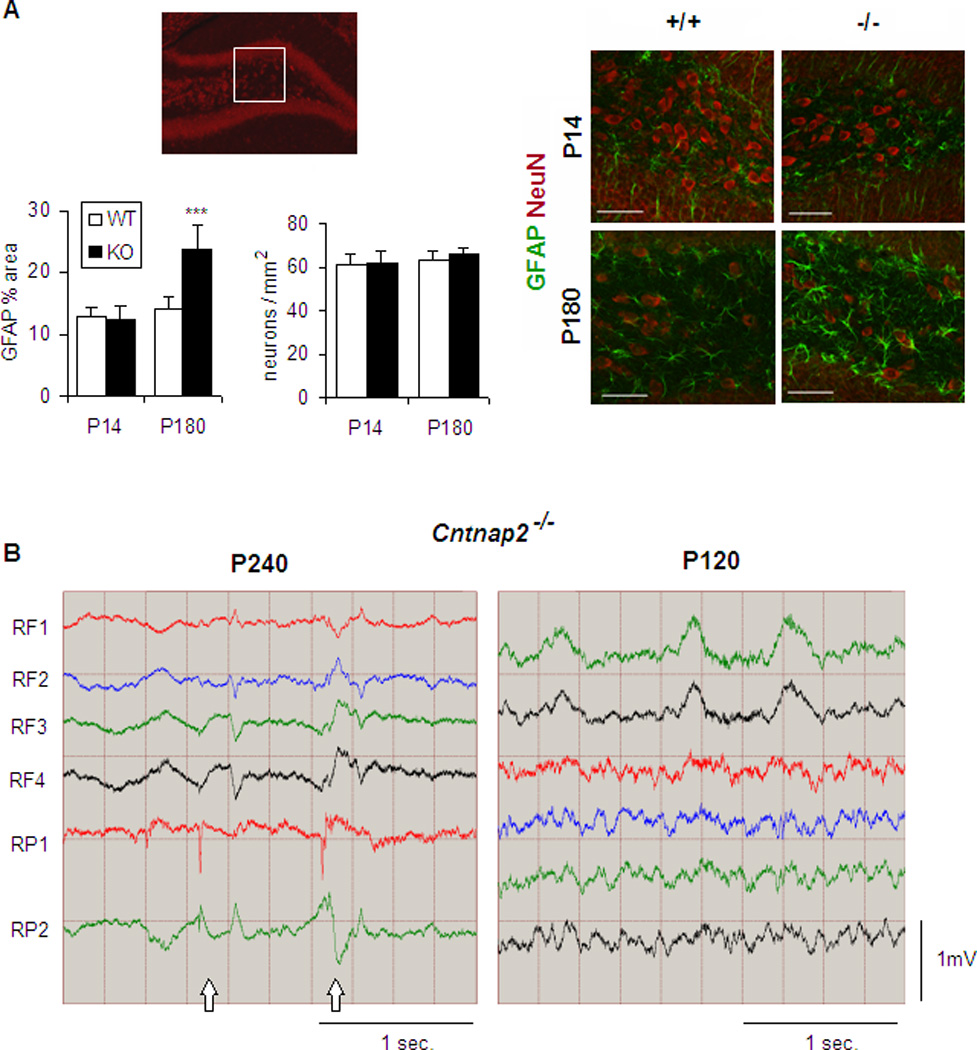
(A) Presence of reactive astrocytes in the hipocampal hilus (inset) of P180 but not P14 mutant mice without significant changes in neuronal density. GFAP, glial fibrillary acidic protein; NeuN, neuronal nuclei. Scale bar: 50 µm. GFAP quantification is shown as % of area occupied by reactive astrocytes. n=4 mice/genotype for each age. Data are presented as mean ± S.E.M. ***p<0.001 (B) EEG recording from mutant mice show abnormal spike discharges (arrows) after seizure onset. n=3 mice for each age. RF, right frontal; RP, right parietal. See also Table S1, Movie S1 and Figure S3C.