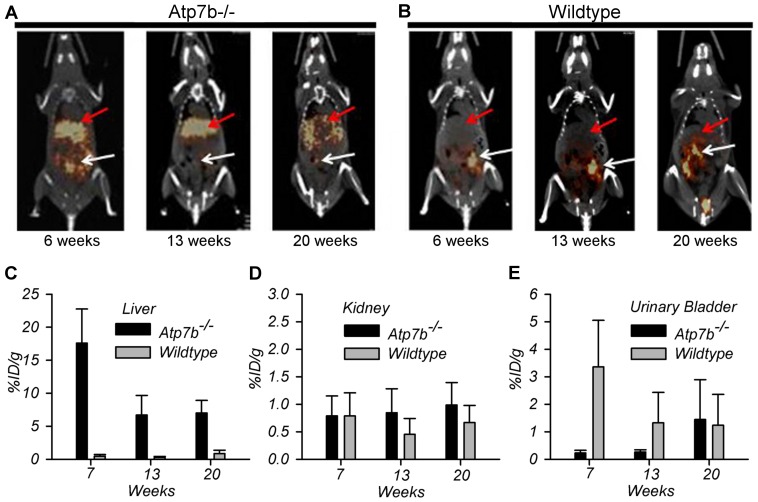
Figure 3. PET-CT analysis of 64Cu distribution in live mice at 24 hrs after oral administration of 64CuCl2.
Representative PET-CT images of (A) Atp7b −/− and (B) wild-type mice at 24 hours post oral administration (PO) of 64CuCl2. Orange-brown color denotes 64Cu radioactivity. Red arrows and white arrows identify liver and gastrointestinal tract 64Cu radioactivity, respectively. (C) Hepatic 64Cu radioactivity in Atp7b−/− and wild-type mice at 24 hrs PO (p<0.001). Age-dependent 64Cu radioactivity in the (D) kidneys (p = 0.38 for group effect) and (E) urinary bladder of wild-type and Atp7b −/− mice at 24 hr PO. %ID/g, percentage of administration dose per gram. Data presented as mean ± SD. N = 5, number of mice with same age and genotype. Additional data and details in Figure S2 and Information S1.

