
Figure 3.
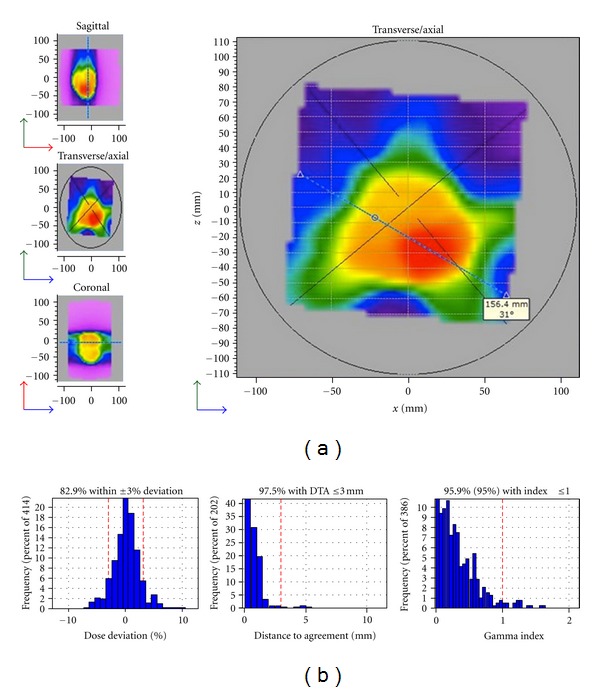
VMAT delivery QA for patient 3. (a) shows the axial distribution obtained by delivering a risk adaptive VMAT plan to the Delta4 phantom. (b) shows the respective distributions for the dose deviation, distance to agreement, and gamma index found for this plan.