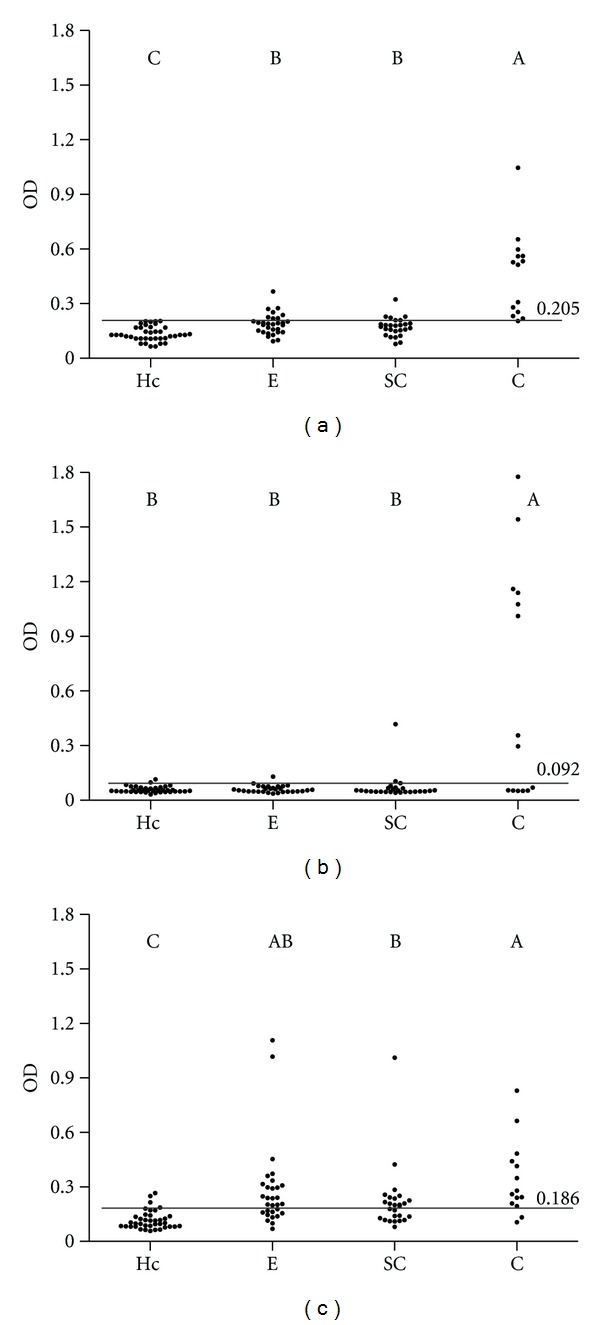
Figure 1.

Results of isotypes/PPA-ELISAs. Dotplots of IgG (a), IgG1 (b), and IgG2 (c) PPA-ELISAs. Antibody responses are plotted as mean optical density (OD); lines and numbers (over lines) represent cut-off points. Letters indicate a significant difference (P< 0.05) between groups. Groups: healthy controls (Hc, n = 38), exposed (E, n= 30), subclinically infected (SC, n = 26), and clinically infected (C, n = 14).
