
Figure 8.
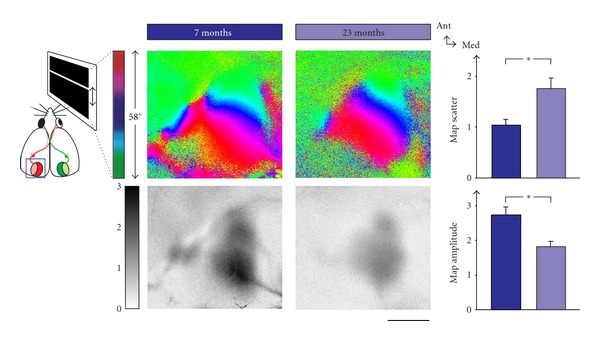
Visual cortical maps deteriorate in old age. Retinotopic phase maps (colour-coded according to scheme on the top left) and corresponding activity maps (coded according to grey scale on the left) are shown for mice of seven and 23 months. Map scatter increases in old mice, while the amplitude decreases. Scale bar is 1 mm and applies to all panels showing maps.