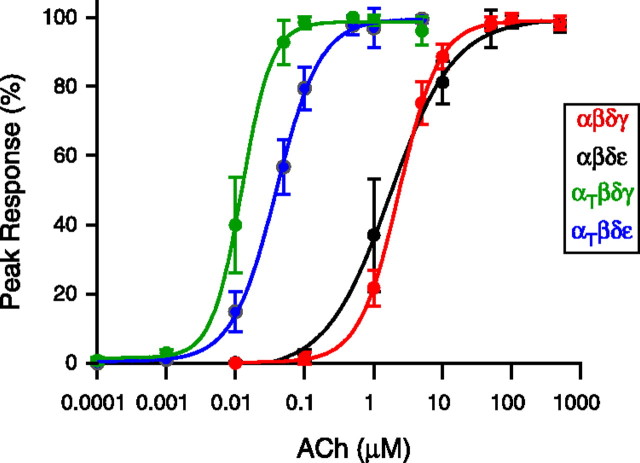
Figure 3.
Dose–response curves obtained for receptor subunit combinations expressed in Xenopus oocytes. Oocytes expressing either αβδγ (red), αβδε (black), αtwiβδγ (green), or αtwiβδε (blue) were voltage-clamped at −50 mV and current responses to fast flow changes in ACh concentration were determined. Each point represents the mean ± SD of the percentage of peak current determined for 6–7 oocytes at each ACh concentration. The dose–response relationships between peak ACh-activated current and ACh concentration were fit to the Hill equation I = Imax/(1 + [K1/2/(A)]n) where I is the current at a given concentration of agonist A, Imax is the peak ACh-activated current, K1/2 is the half-maximal concentration, and n is the Hill coefficient.

