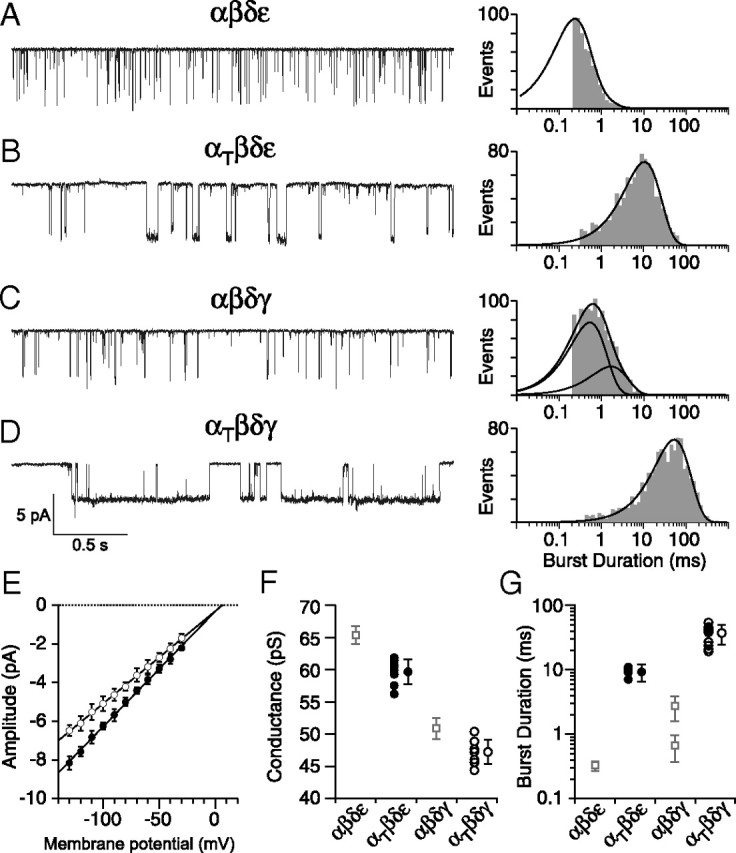
Figure 4.

ACh-activated single-channel currents associated with different receptor isoforms. A–D, Representative single-channel recordings of ACh-activated currents from outside-out patches of Xenopus oocytes expressing either (A) αβδε, (B) αtwiβδε, (C) αβδγ, or (D) αtwiβδγ receptors. Example semilog burst duration histograms for each receptor isoform fit with either a single exponential (A, B, D) or biexponential (C) function. E, Cumulative current–voltage relations showing mean ± SD for αtwiβδε (filled circles, n = 8 recordings) and αtwiβδγ (open circles, n = 8 recordings) with linear fits. F, Scatterplot of mean slope conductances obtained for individual recordings from αtwiβδε (filled circles) and αtwiβδγ (open circles) shown alongside the overall mean ± SD for each distribution. The mean ± SD for wild-type counterparts are shown as open squares (taken from Mongeon et al., 2011). Between 31 and 111 events were used to generate each point in E and F. G, Scatterplot of mean burst duration from αtwiβδε (filled circles, n = 7 recordings) and αtwiβδγ (open circles, n = 10 recordings) receptors along with the overall mean ± SD. Between 659 and 1147 events for each recording were used to generate the individual mean values. The wild-type mean ± SD counterpart values are shown as open squares (taken from Mongeon et al., 2011).
