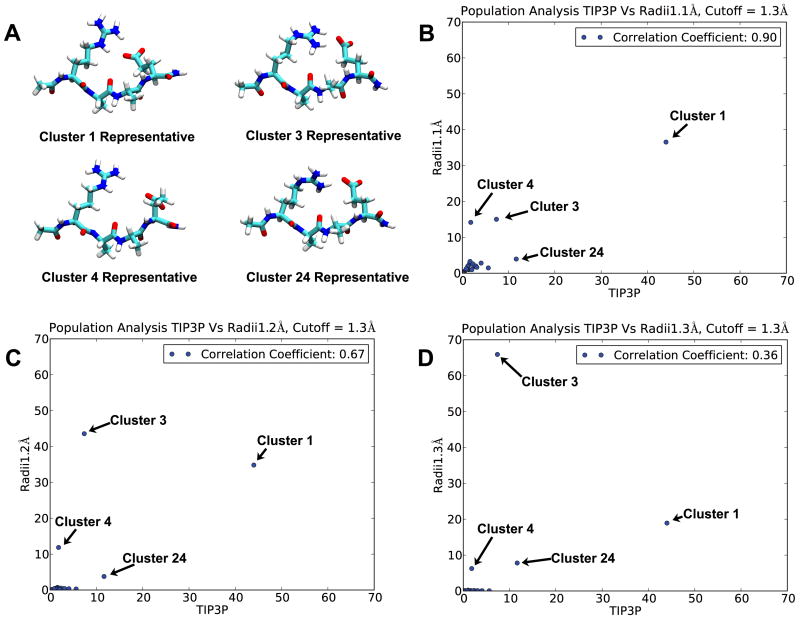
Figure 3.
Cluster analysis results. Cluster analysis was done on combined trajectory including EXP simulation, GB 1.1 Å Hn simulation, GB 1.2 Å Hn simulation and GB 1.3 Å Hn simulation trajectories. Representative structures of four largest clusters (cluster 1, cluster 3, cluster 4 and cluster 24) are shown in figure A. The structural distribution of each GB simulation is plotted against EXP's in figure B, C and D, with the axes indicating the percentage of structures that fall into a given cluster. Ideally if a certain GB model is 100% correlated with EXP, all clusters should be equally populated by GB and EXP structures (all data points would be on the diagonal) indicating that the GB simulation provides an excellent reproduction of salt bridge behavior in EXP.

