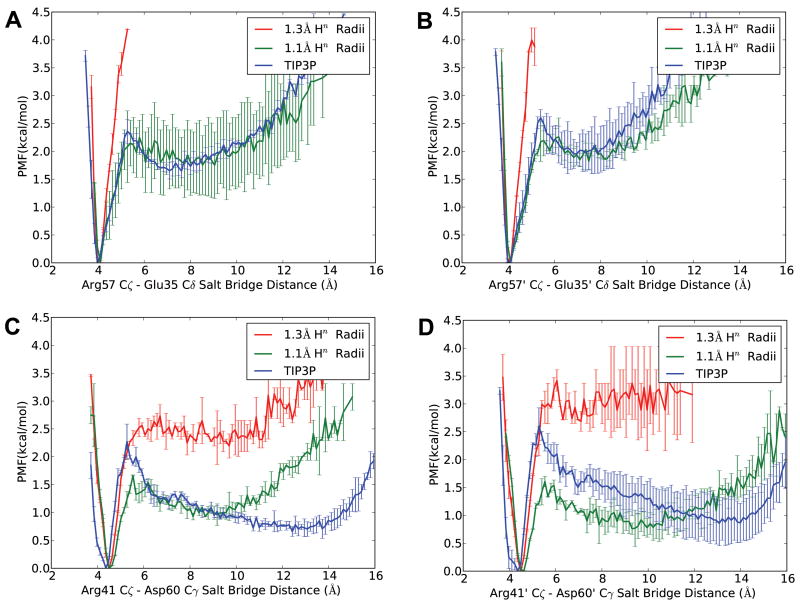
Figure 5.
PMF of salt bridges involving Arg in HIVPR simulation, showing salt bridge distances between Arg57_Cζ and Glu35_Cδ on each monomer (figure A and B), and between Arg41_Cζ and Asp60_Cγ on each monomer (figure C and D). Error bars in each set were obtained by comparing PMF generated using the first and second half of data.

