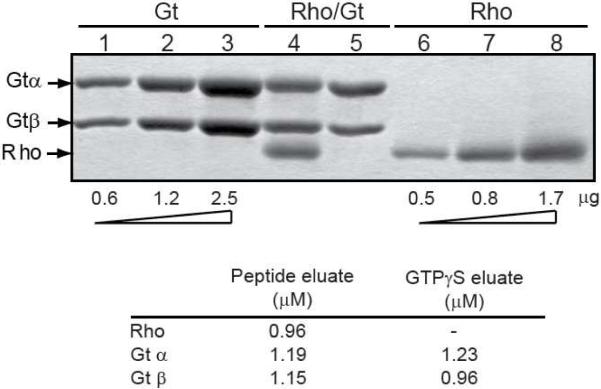
Figure 6.
Densitometric determination of subunit stoichiometry in the activated rhodopsin/transducin complex. (A) SDS-PAGE analysis of the activated rhodopsin/transducin complex. Lanes 1–3, known standards of increasing amounts (as indicated) of purified transducin; lanes 6–8, known standards of increasing amounts (as indicated) of the N2C,E113Q,D282C mutant; lane 4, activated rhodopsin/transducin complex, purified on 1D4-Sepharose as in Figure 2; lane 5, GTPγS eluate from 1D4-Sepharose matrix. Only the α- and β-subunits of transducin are shown. (B) Quantification of the complex subunits in A, lanes 4 & 5 as determined by densitometry. Individual bands from SDS-PAGE gels were quantified as described in Experimental Procedures using ImageJ software and standard curves derived from known amounts of transducin and the rhodopsin N2C,E113Q,D282C mutant. The calculated concentration of released β-subunit in the GTPγS eluate suggests a fraction of this subunit is retained on the solid support.

