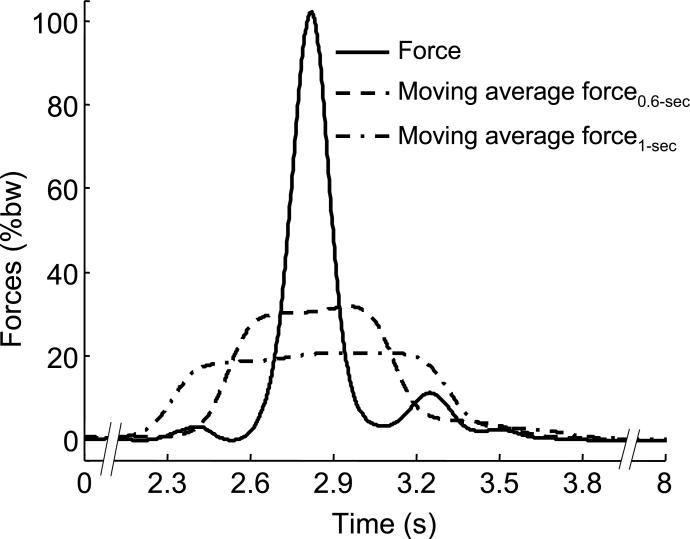
Fig. 2.
The load cell force profile for a subject (body mass = 61.3 kg, body height = 1.71 m) during a slip trial (the solid line). Also shown are the moving average forces of the load cell over 0.6 s (the dash-dotted line) and 1.0 s (the dashed line). All forces are normalized to the body weight (bw).

