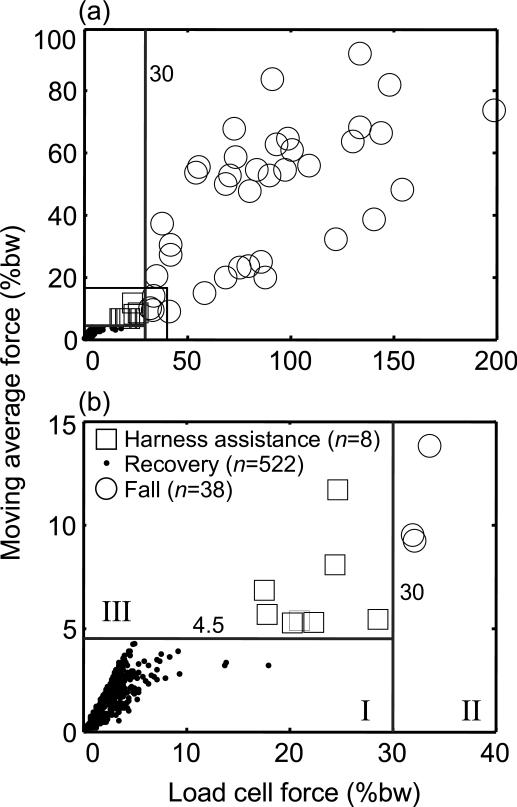
Fig. 5.
The distribution of the combinations of the peak load cell force and the corresponding moving average force over 1 s for all older subjects. Data point for each trial is plotted as circle (fall), dot (recovery), and square (harness assistance). Also shown are the threshold values to classify slip outcome derived based on the data from young subjects. The space formed by the moving average force and the load cell force is divided by these threshold values into three sections. Section I/II/III respectively corresponds to the recovery/fall/harness assistance region. Both force and moving average force of the load cell are measured as percentage of the body weight (bw). A portion of the space in (a) is enlarged to illustrate more clearly the relationship between the distributions and the threshold values as (b).

