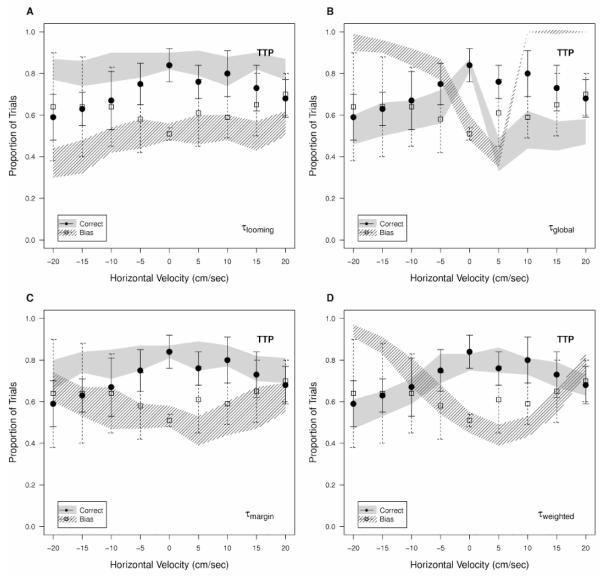
Figure 9.
Comparison of performance (solid circles for human subjects, solid shaded area for the model) and bias (open squares for human subjects, dashed region for model) in the TTC task with irrelevant angular motion added. Human psychophysical data is compared to (A) a model based on looming velocity alone, (B) a model based on global τ, (C) a model using the τmargin formulation, and (D) a model using the τweighted formulation. Error bars and shading are ±1 standard deviation across subjects and model simulations respectively.

