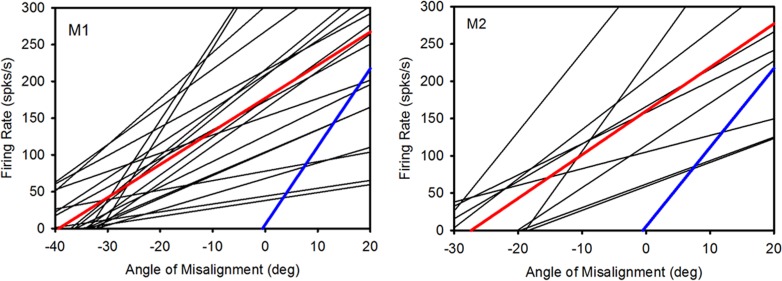
Figure 5. .
Summary of response properties of SOA near-response cells in animals M1 and M2. Each black line represents the rate-misalignment curve for a single SOA cell. The x-intercept is the threshold or angle of misalignment at which the cell commences firing. The slope is a measure of the sensitivity of the cell. The red line is the population average of all the SOA near-response cells of the sample in each monkey. Shown for comparison is population average for normal monkeys (blue line; redrawn from Mays 1984).

