Figure 1. .
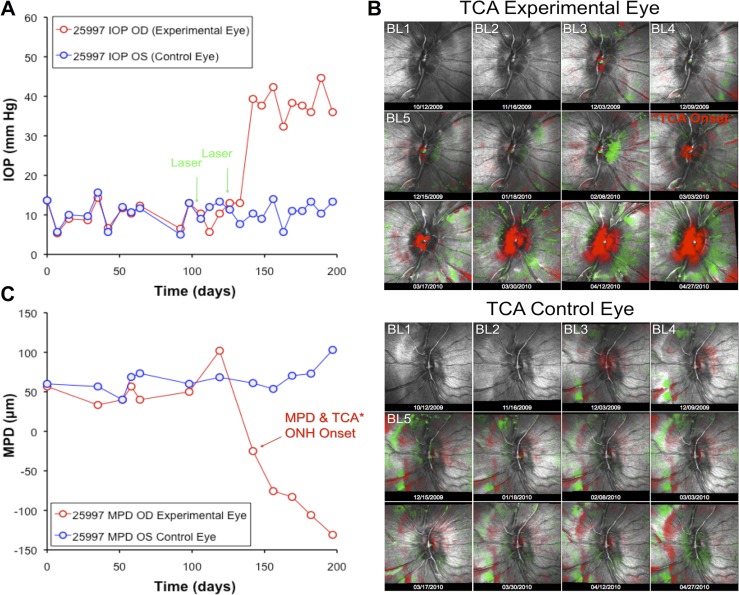
Example of experimental time course for a single representative animal. (A) IOP versus time. Green arrows indicate dates of trabecular meshwork laser photocoagulation. (B) ONH surface topography over time, with TCA showing significant posterior (red pixels) and anterior (green pixels) deformation as compared with baseline (BL). (C) The CSLT parameter MPD versus time.

